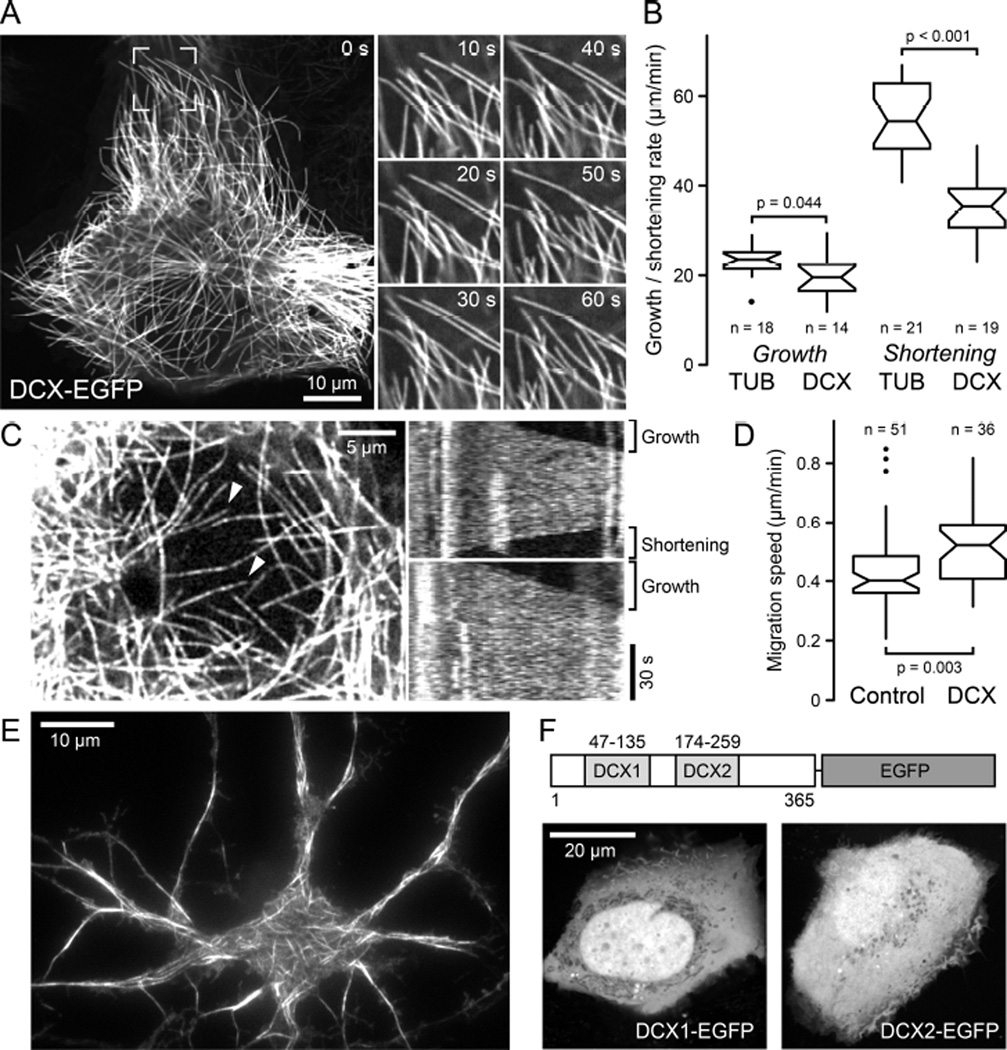
Figure 1. DCX-EGFP associates along MTs and does not accumulate at MT ends in cells.
(A) Localization of lentivirus-transduced DCX-EGFP along MTs in a stably expressing HaCaT cell. Images on the right show the boxed region at higher magnification and indicated time intervals, illustrating MT growth and shortening. See also Movie S1.
(B) MT growth and shortening rates in tubulin-EGFP expressing cells (TUB) compared with DCX-EGFP expressing cells (DCX). n = number of MTs in 5 cells per condition. Notches indicate 90% confidence intervals.
(C) DCX-EGFP dynamics in a low expressing cell. Kymographs of MTs marked with arrowheads from one frame per second time-lapse recording show rapid fluctuations of DCXEGFP intensity indicative of rapid binding kinetics and no indication of plus ends accumulation during phases of growth or shortening. See also Movie S3.
(D) Comparison of HaCaT cell migration speed in control and DCX-EGFP expressing cells (DCX). n = number of cells from 3 experiments.
(E) Total internal reflection microscopy image of live DCX-EGFP lentivirus transduced rat primary neurons showing DCX-EGFP binding along MTs.
(F) HaCaT cells transiently transfected with either N- or C-terminal DCX domains tagged with EGFP.

