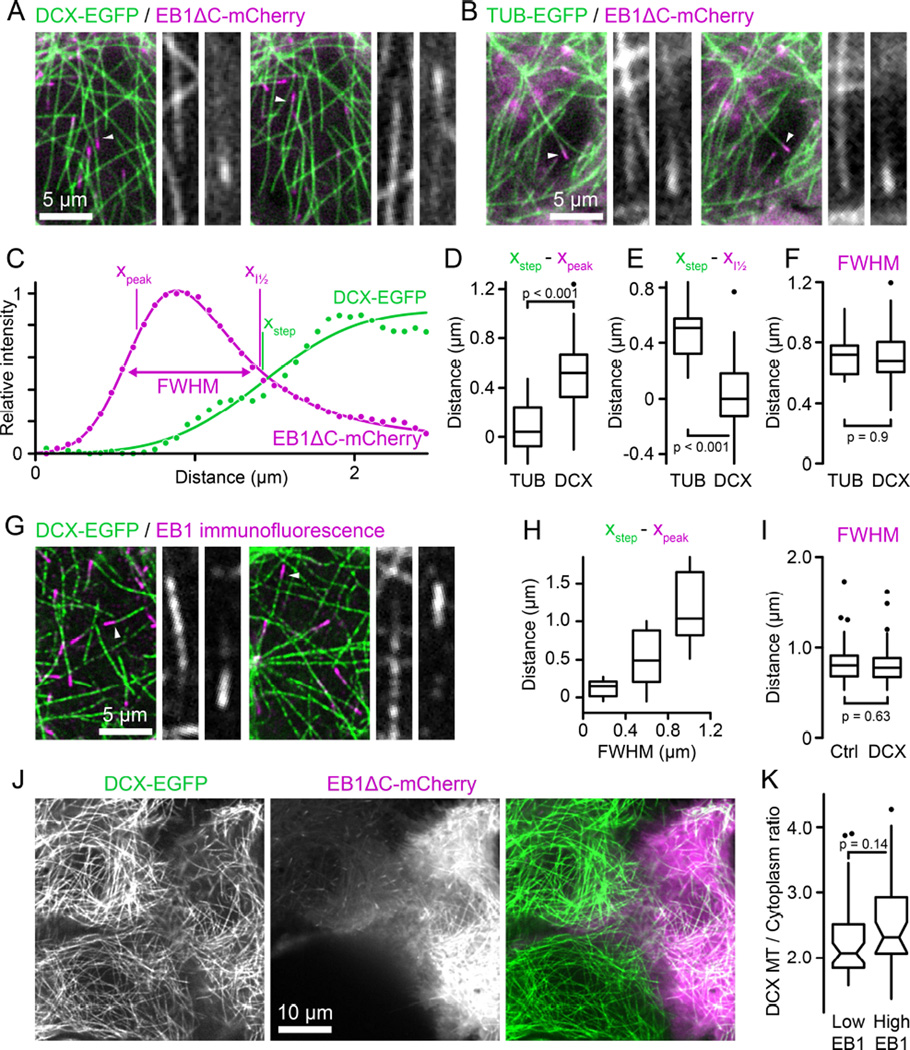
Figure 2. DCX and EB1 bind mutually exclusive domains on MTs.
(A) DCX-EGFP expressing HaCaT cell transiently transfected with EB1ΔC-mCherry. Both channels were acquired simultaneously using an emission beamsplitter and corrected for spatial shift between images. Gray scale panels show the individual DCX-EGFP and EB1ΔC-mCherry channels for the MTs highlighted by arrowheads at higher magnification illustrating that DCX is excluded from the EB1 domain. See also Movie S4.
(B) Tubulin-EGFP expressing HaCaT cell transiently transfected with EB1ΔC-mCherry acquired as described in (A).
(C) EB1ΔC-mCherry and DCX-EGFP intensity profiles corresponding to the right panel shown in (A). Solid lines are curve fits with Gaussian-convolved models as described in the text. xpeak and xstep indicate the positions of the underlying exponential and step functions, respectively. Note that because of the asymmetry of the exponential decay xpeak does not coincide with the maximum of the Gaussian-convolved function. xI½ is the position of the half-maximum of the Gaussian-convolved exponential decay, and FWHM the width of the Gaussian-convolved exponential decay at half-maximum intensity.
(D) Comparison of the distance between the maximum of the EB1ΔC-mCherry exponential decay and the TUB-EGFP or DCX-EGFP half-maximum calculated from the curve fits.
(E) Comparison of the distance between the half-maximum of the EB1ΔC-mCherry decay and the half-maximum of the TUB-EGFP or DCX-EGFP curve fits.
(F) Widths of the EB1ΔC-mCherry comet at half-maximum intensity in TUB-EGFP or DCX-EGFP expressing cells. n = 12 MTs from 5 cells (TUB) and 46 MTs from 11 cells (DCX) in (D) to (F).
(G) Endogenous EB1 staining in EGFP-DCX expressing HaCaT cells. Gray scale panels show the individual DCX-EGFP and EB1 channels for the MTs highlighted by arrowheads at higher magnification illustrating that DCX is excluded from the EB1 domain. See also Figure S1.
(H) Distance between the maximum of the exponential decay of EB1 immunofluorescence and the half-maximum of the DCX-EGFP curve fit as a function of EB1 comet width. n = 45 MTs from 19 cells.
(I) Widths of the EB1 comet at half-maximum intensity in control or DCX-EGFP expressing cells. n = 78 MTs from 14 cells (Ctrl) and 106 MTs from 16 cells (DCX).
(J) DCX-EGFP expressing HaCaT cells expressing different levels of EB1ΔC-mCherry. The cell on the right is expressing high levels resulting in EB1ΔC-mCherry binding along MTs. Yet, there is no obvious difference in DCX-EGFP binding to MTs.
(K) Quantification of relative DCX-EGFP binding to MTs in cells expressing low or high levels of EB1ΔC-mCherry. n = 44 MTs in 8 cells per condition.

