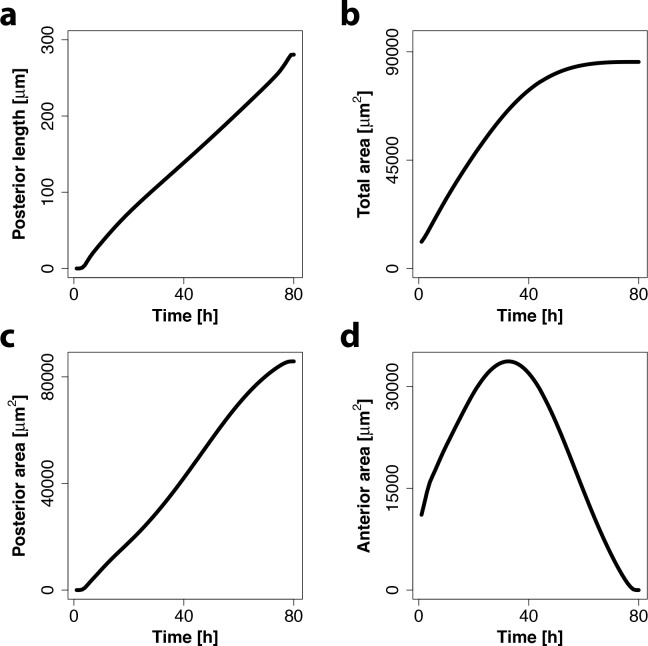
Fig 4. Eye disc model captures linear MF movement and growth termination.
(a) Simulated progression of MF is approximately linear over time (black line). The speed of the MF movement is determined by a linear fit and is ≈3.4 μm h-1. (b-d) Simulated total area (b), posterior area (c) and anterior area (d) over time in the eye disc model show growth termination towards the end of development.

