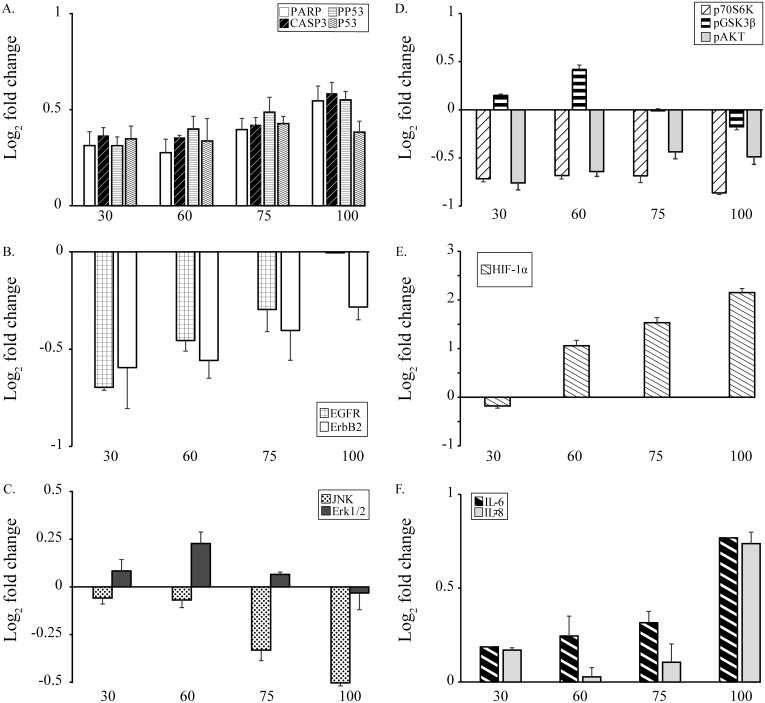
Fig 1. Changes in protein expression of the 14 pathway regulators induced by Ni (II).
Panel A: Apoptosis panel proteins cleaved PARP, cleaved caspase-3, p53, pp53; Panel B: Two cell growth panel proteins EGFR and ErbB2; Panel C: MAP Kinase panel proteins JNK and Erk1/2; Panel D: phosphorylated p70S6K, GSK3β, and Akt; Panel E: HIF-1α; Panel F: IL-6 and IL-8. X-axis is Ni (II) concentrations (μM). Y-axis: log2 relative-fold change of expression and/or phosphorylation levels compared to untreated controls measured using multiplexed ELISA. Protein significantly altered over the corresponding controls were identified and plotted as up-regulated (above the X-axis) or down-regulated (blow the X-axis). Statistical differences in protein expression or phosphorylation between Ni (II) treated and control group were determined by Student’s t-test (n = 3, p < 0.05).

