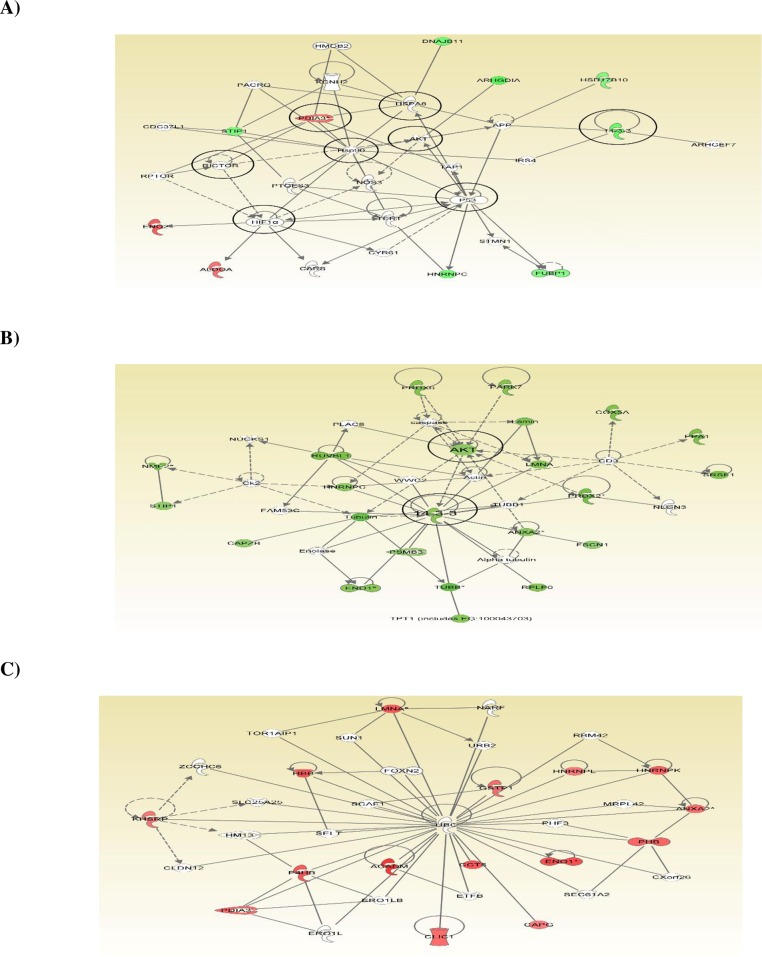
Fig 5. Networks of proteins showing inter-relationships and pathways which was obtained using IPA.
A) A sub-network of some differentially expressed proteins identified from BEAS-2B cells treated with 100 μM of Ni (II). Green fields indicate down-regulation and the red fields indicate up-regulation of the differentially expressed proteins. B) Network of the proteins altered at multiple concentrations that were down-regulated. C) Network of the proteins altered at multiple concentrations that were up-regulated. For protein network or pathways analysis, statistical significance was determined with Fisher’s exact test (p < 0.05).

