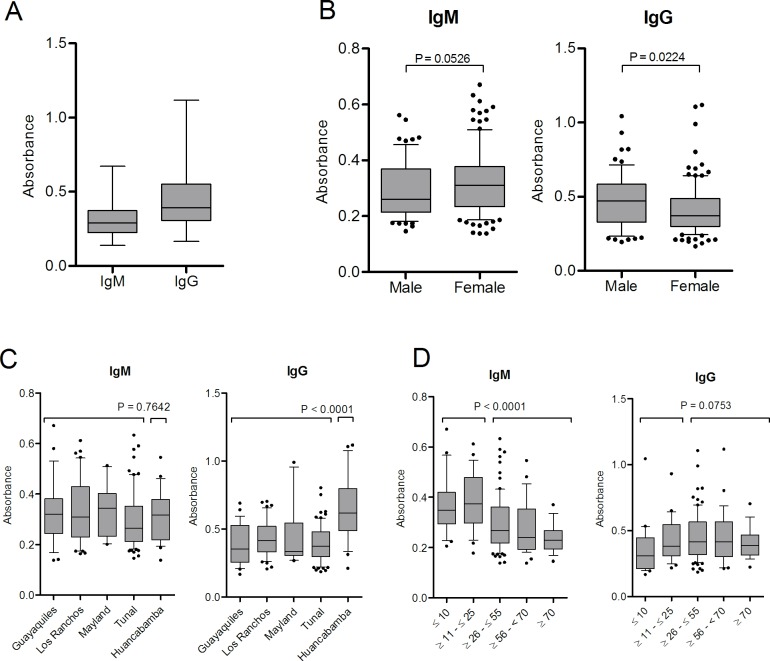
Fig 3. IgM and IgG antibodies in the study population.
A) Overall data. Data are presented as boxplots that illustrate the medians and the maximum and minimum. B) IgM and IgG distribution by sex; C) IgM and IgG distribution by locality. P-values obtained on comparing the 4 post-outbreak areas with the endemic area. When comparing pairs of localities we obtained significance for IgG with the following analysis: Guayaquiles and Huancabamba (P = 0.0001); Los Ranchos and Huancabamba (P = 0.0002); Mayland and Huancabamba (P = 0.0201); Tunal and Huancabamba (P<0.0001). D) IgM and IgG distribution by age groups. P-values obtained comparing the antibody levels of subjects between ≤ 25 years with ≥ 26 years. In panels B, C and D the data are presented as boxplots that illustrate the medians and the 25th and 75th quartiles, and the whiskers represent the 10% and 90% percentiles. Outliers are marked with circles. P-values were calculated using the Mann-Whitney test.

