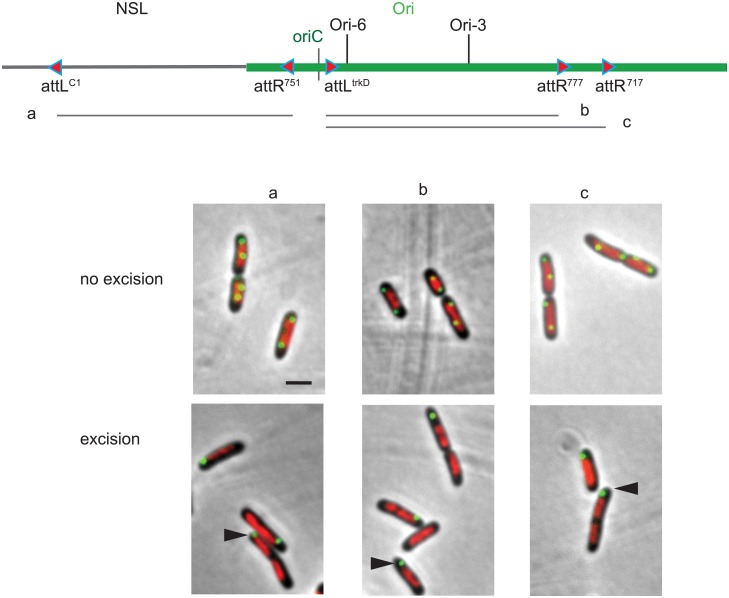
Fig 5. Exclusion from the nucleoid of large DNA rings looped out from the Ori region of the chromosome.
Montage of merged pictures of parSP1 (green), DAPI staining (red) and phase-contrast micrographs (grey) of FBG150 cells upon excision of chromosomal DNA segments carrying the parS tag. The extent of the excised segment is indicated on the diagram above the micrographs (segments a, b and c). Control sample in the absence of excision is presented on the top lane (no excision). Black arrowheads indicate Ori markers present on excised rings. Scale bar indicate 2 μm.

