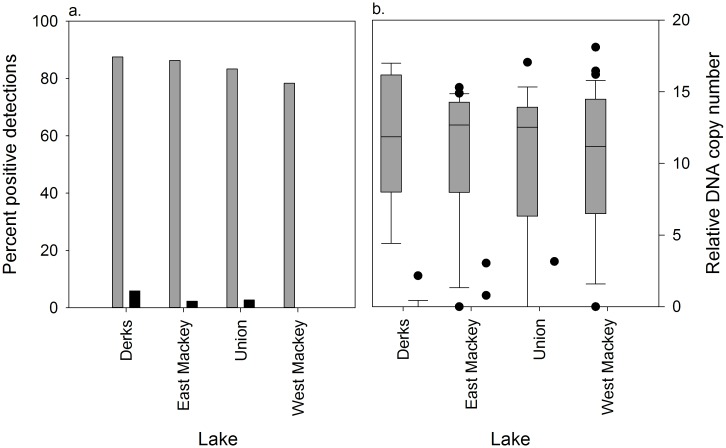
Fig 6. Percent positive detections and relative DNA copy number before and after rotenone eradication treatments.
(a) Percent positive detections and (b) relative DNA copy number before (gray filled) and after (black filled) rotenone eradication treatments in Derks, East Mackey, Union and West Mackey lakes near Soldonta, AK. Relative DNA copy numbers are displayed as box plots, with the dark horizontal line representing the mean, the box representing the 25th and 75th percentiles, the whiskers representing the 5th and 95th percentiles and the filled circles representing outliers. eDNA water samples were collected ~ 30 days before and ~ 230 days after the rotenone treatments.

