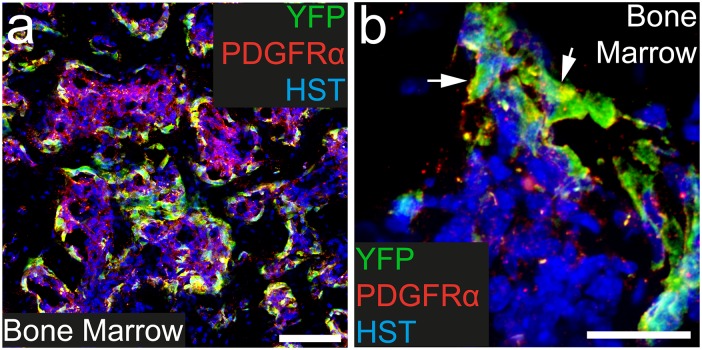
Fig 6. A proportion of PDGFRα+ cells become YFP- labeled in the bone marrow.
Transverse cryosections taken through the tail of P57+7 Pdgfrα-CreERT2::Rosa26-YFP transgenic mice were immunostained to detect PDGFRα (red), YFP (green) and HST (blue). Confocal images (single z plane) of the bone marrow at low (a) and high (b) magnification. PDGFRα+ YFP+ cells are denoted by arrowheads. Scale bars represent 100μm (a) and 25μm (b).

