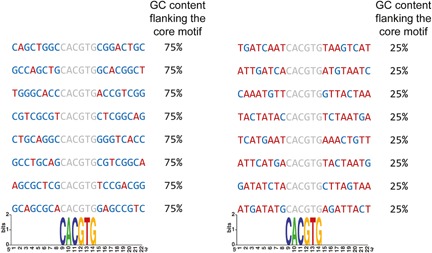
Figure 3.

Illustration emphasizing the drawback of position specific information content based approaches to identify preferences for the motif environment. In this example the sequences are aligned by the shared E‐box motif CACGTG (marked in gray), represented by very high information content at each position. However, while the motif is surrounded by high GC content in the left (marked in blue, 75% GC content flanking the core motif in each sequence), and high AT content in the right (marked in red, 75% AT content flanking the core motif in each sequence), both groups have very low (undetectable) information content in these regions.
