
Fig 2. Sequential stopping for the three arms.
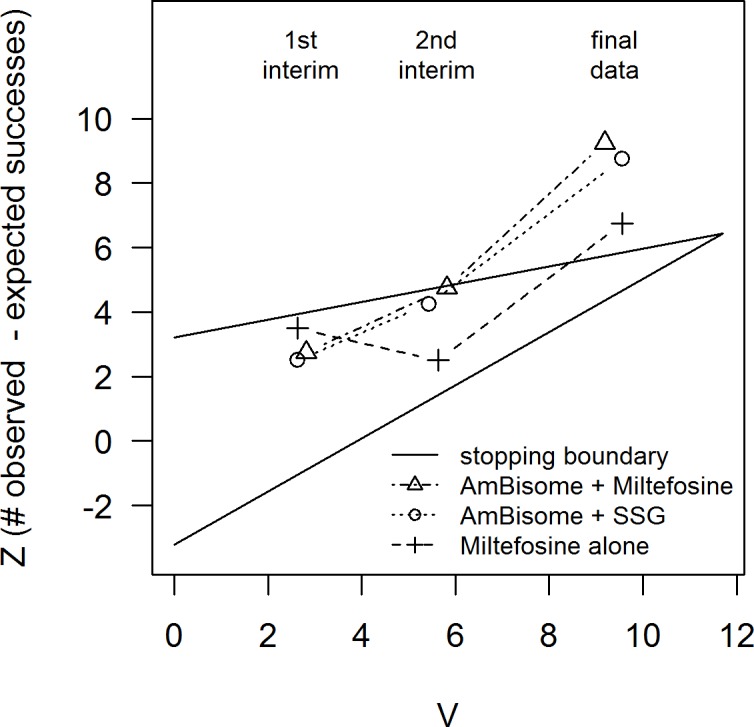
The horizontal axis (V) is proportional to sample size. The vertical axis (Z) is the observed minus expected number of cures, so higher values are more favourable. Each arm is shown by a line with three points representing, from left to right, the first interim analysis (decision: continue for all arms), the second interim analysis (decision: continue for all arms) and the final analysis. The final analysis (shown here) includes patients whose follow-up was still in progress at the time of the third interim analysis, and confirmed the ‘stop’ decisions. Having all stopped at the same analysis, the point estimates of proportion cured are the same for all arms (85%), as are the 95% confidence intervals (77–97%). Based on the probability tree method, the point estimate at day 210 for AmBisome + SSG is 87% (95% CI 77–97%); for AmBisome + Miltefosine it is 77% (64–90%) and for Miltefosine 72% (60–85%).