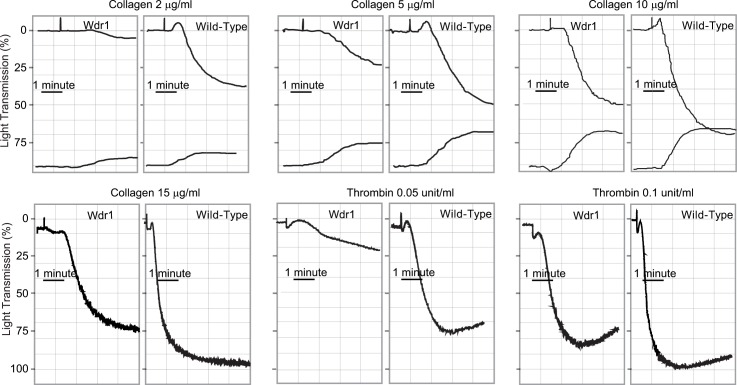
Fig 2. Platelet aggregation in Wdr1-hypomorphic mice.
Platelets were isolated from both Wdr1-hypomorphic mice and littermate wild-type controls and stimulated with various concentrations of collagen (Panels A-D) or thrombin (Panels E and F). Aggregations were measured using a turbidometric aggregometer. In the upper panel, the top tracings reflect platelet aggregation while the bottom tracings indicate ATP secretion. The traces shown are representative of at least 3 or more independent experiments.

