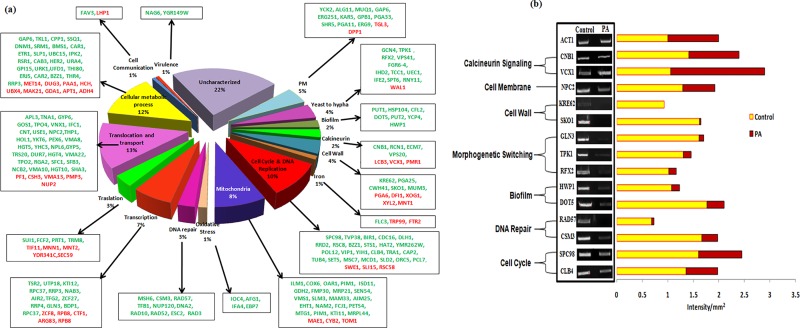
Fig 2.
(a) Transcriptional profiling of C. albicans in response to PA. Pie chart showing various gene categories differentially regulated in PA treated cells. Green color show downregulated genes and red color shows upregulated genes. (b) RT-PCR of differentially regulated genes in response to PA. The left panels show transcript levels of CNB1, VCX1, NPC2, KRE62, SKO1, GLN3, TPK1, RFX2, HWP1, DOT5, RAD57, CSM3, SPC98, CLB4 in lanes (1) Control, (2) PA (175μg ml-1). The right panel shows the quantitation (density expressed as Intensity/mm2) of the respective transcripts normalized with constitutively expressed ACT1 transcripts.

