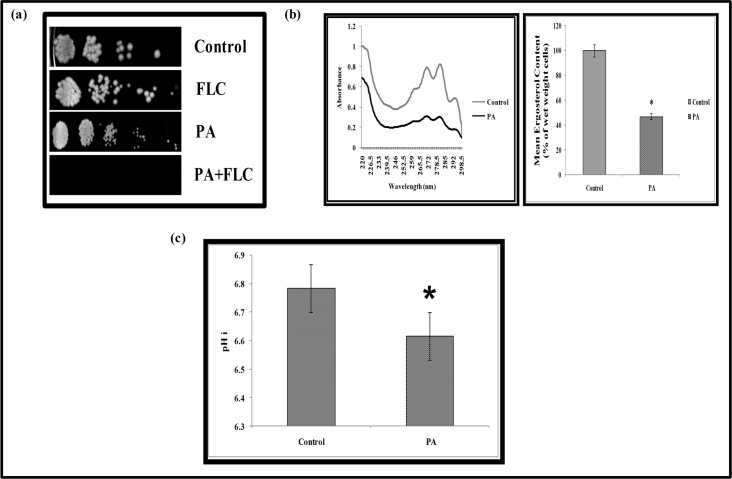
Fig 5. Effect of PA on cell membrane of C. albicans.
(a) Spot assay with FLC (1μg ml-1), PA (175μg ml-1) and in combination of both. (b) Left panel shows UV spectrophotometric ergosterol profiles of C. albicans scanned between 220 and 300 nm from overnight culture grown in absence (control) and presence of PA (175 μg ml-1). Right panel shows relative percentages of ergosterol content in the absence (control) and presence of PA (175 μg ml-1). Mean of % ergosterol levels is calculated as described in materials and methods normalized by considering the untreated control as 100 ± SD of three independent sets of experiments is depicted on Y-axis and * depicts P value <0.05. (c) Intracellular pH (pHi) in presence of PA (MIC80) in C. albicans cells. Mean of pHi ± SD of three independent sets of experiments is depicted on Y-axis with respect to control & PA on X- axis and * depicts P value <0.05.

