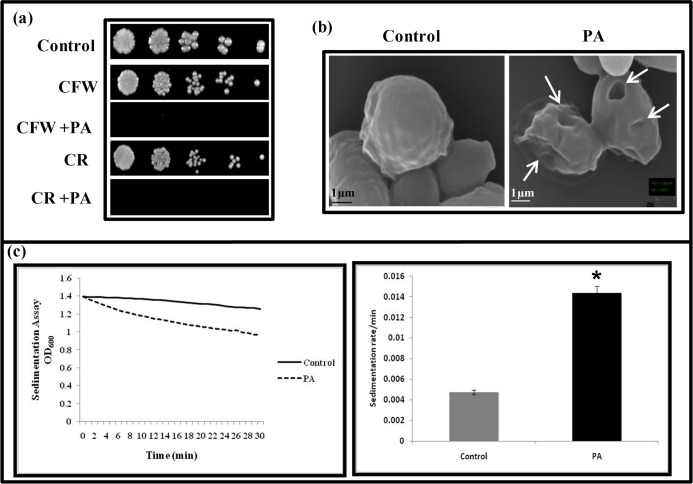
Fig 6. Effect of PA on the cell wall integrity of C. albicans.
(a) Susceptibility assay showing hypersensitivity to PA (175 μg ml-1) in the presence of cell wall perturbing agents; CFW (10 μg ml-1) and CR (10 μg ml-1). (b) SEM images showing the smooth surface of untreated cell (control) and the crinkled cell wall with the leakage of its cell contents (marked with an arrow) because of the extensive damage caused due to PA. (c) Relative sedimentation of C. albicans cells. Left panel shows O.D600 of untreated (control) and PA treated (175 μg/mL) cells depicted on y-axis with respect to time (minutes) on x-axis. Right panel shows sedimentation rates per min on y-axis for control and PA on x-axis, calculated by estimating the difference in OD600 from 0 till 30 min per unit interval.

