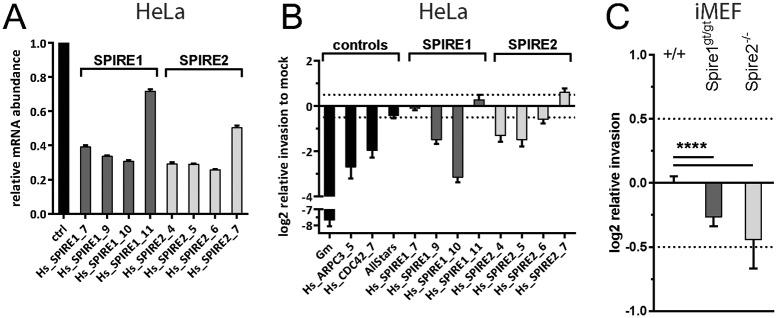
Fig 3.
(A) SPIRE1 and SPIRE2 expression as measured by RT-qPCR upon RNAi treatment. Columns represent mean and error bars show standard deviation. (B) Small scale validation screen using S. TmSipA and the modified gentamicin protection assay to confirm phenotype of SPIRE2. (C) Modified gentamicin protection assay using Spire1gt/gt and Spire2-/- iMEFs infected with S. TmSipA normalized to the wild type iMEF control cell line. A shows data from 2 independent experiments with 2 replicates each in HeLa Kyoto cells. B and C show data from 3 independent experiments with 3 replicates each. Asteriscs indicate significant differences. *: p<0.05.

