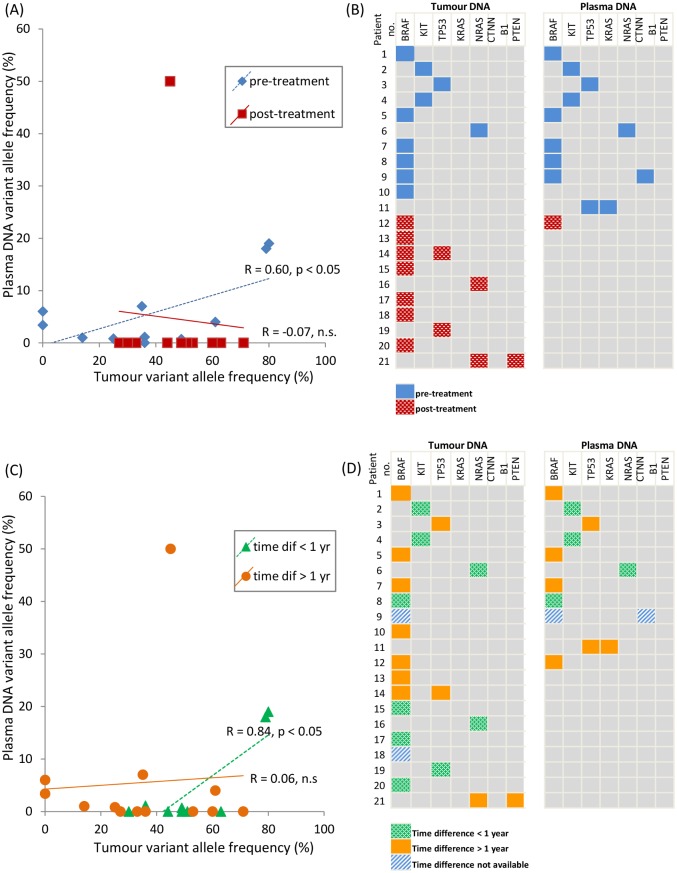
Fig 1. Factors affecting correlation between tumour and plasma DNA variants in melanoma patients.
Tumour and plasma DNA from melanoma patients were sequenced using Ampliseq Cancer Hotspot Panel (8–10 samples per 318 chip), and variant results were compared in relation to two factors, pre- or post-treatment sampling and time difference between sampling of tumour and plasma. (A) Pre- or post-treatment correlation. Blood samples taken before treatment are denoted by blue diamonds, dashed line, and samples taken post-treatment are shown by red squares, solid line; (B) Mutated genes in tumour and plasma DNA, marked in blue if plasma taken pre-treatment, red pattern if plasma was post-treatment; (C) Time difference correlation. Blood samples taken less than a year after biopsy are plotted as green triangles, dashed line, and samples taken more than a year after biopsy are shown as orange circles, solid line; (D) Mutated genes in tumour and plasma DNA, marked in green pattern if time difference between biopsy and blood sampling < 1 year, solid orange if time difference > 1 year (tumour biopsy date not available for patients 9 and 18, marked in blue stripe).

