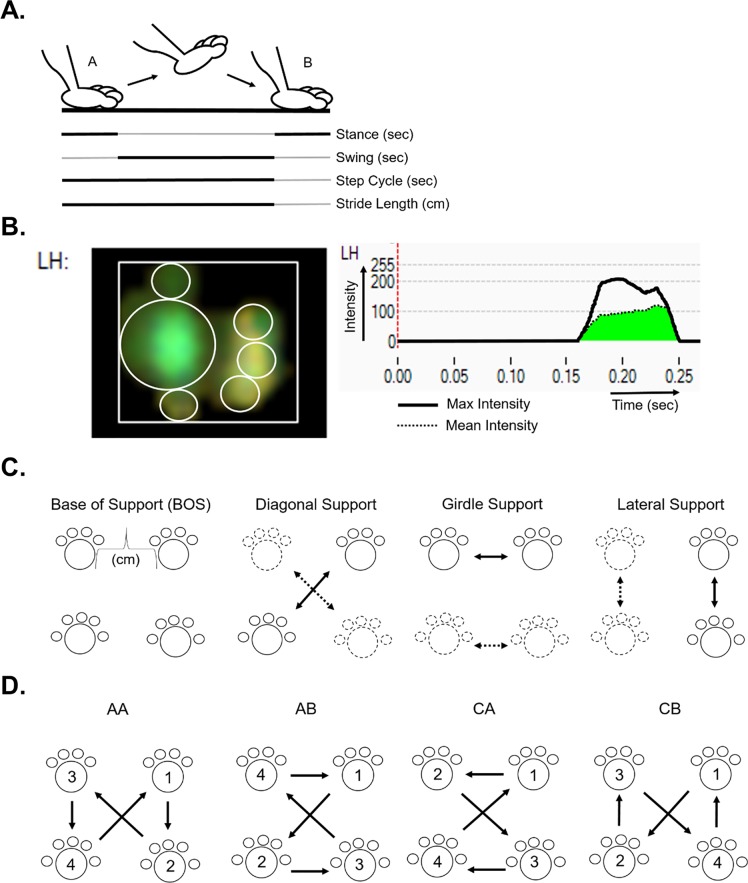
Fig 1. Gait metric overview.
(A) Single paw representation of gait cycle between point A and B along a walkway. Separate gait metrics are defined by solid black lines within the gait cycle. (B) Screen capture images of the Noldus Catwalk System software showing print measurements and recorded intensities for the left hind paw of a P448L mouse. Light displacement leaves a green paw print on the walkway as shown and is used to derive print surface area metrics and intensity. The latter is an indication of weight supported by the paw. Intensity is measured in real time, graphed and used to calculate the highest intensity pixel in the print, Max Intensity (black line), and the Mean Intensity of all pixels (green area under curve). (C) Summary of support metrics. Solid prints and arrows represent a support pair, the opposite pairs are represented as fragmented prints and arrows. (D) Common step patterns include the alternate patterns AA and AB and the cruciate patterns CA and CB. Numbers and arrows indicate step order. The right front paw was arbitrarily chosen as the initial step.

