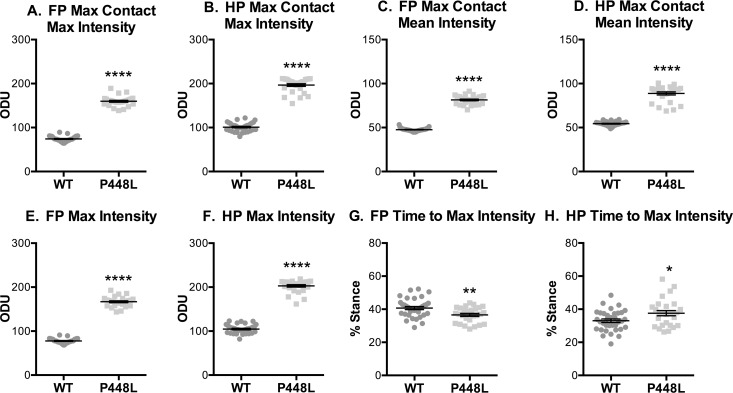
Fig 5. Paw Intensities.
Fore paw and hindpaw measurements of greenlight intensity with an optical density green light threshold of 0 to 255. These measurements include (A,B) the highest and (C,D) average pixel intensity during the time of maximum contact with the walkway. (E,F) This also includes the highest intensity recorded at any point during stance phase and (G,H) the time it takes to reach the highest intensity as represented as a percentage of the stance time. (FP = fore paw, HP = hindpaw, ODU = Optical Density Units, n = 12; *p<0.05; **p≤0.01, ****p≤0.0001).

