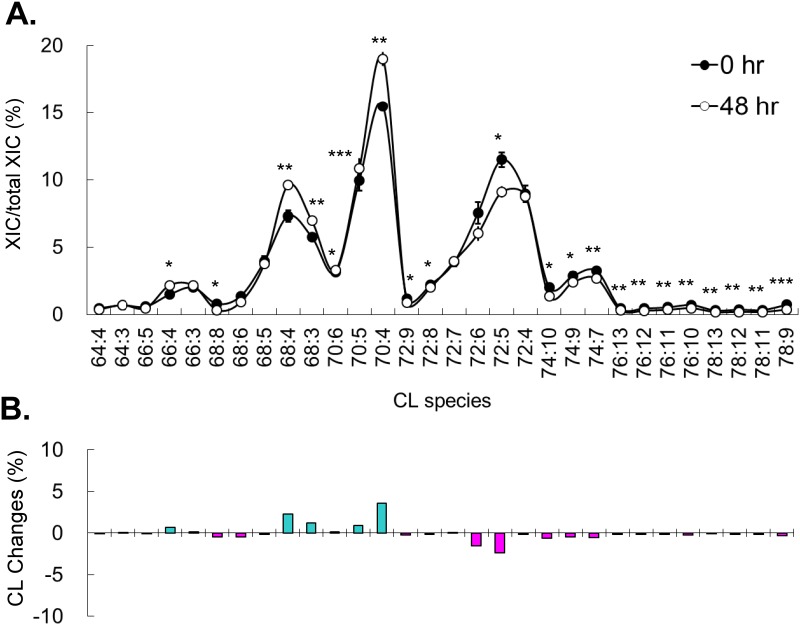
Fig 4. Mitomycine C induced CL content changes.
(A) Percentage of CL species in control and after 48-hr of mitomycine C treatment. Experiments are in triplicates and analyzed by t-test (*p < 0.05, **p < 0.01, ***p < 0.001). (B) The changes of CL contents after 48-hr of mitomycine C treatment. Total extracted ion current (XIC) is the total XIC of all detected CL.

