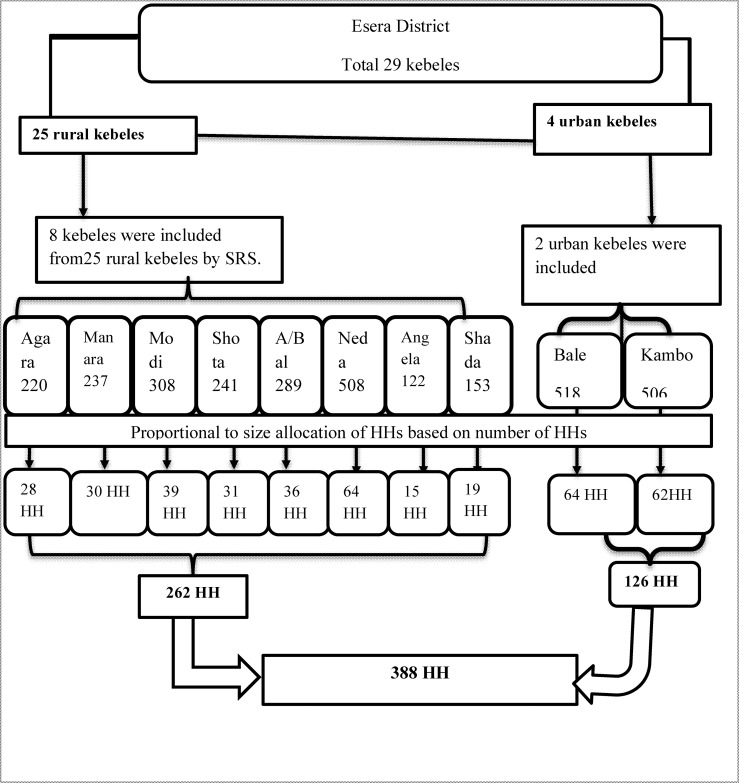
Fig 1. Diagrammatic presentation of sampling technique and procedure.
Fig 1 shows the graphic presentation of recruitment of households included in the study. District stratified in to rural and urban; kebeles in both urban and rural selected via SRS; census was conducted among the selected kebeles; and households were allocated via PPS.

