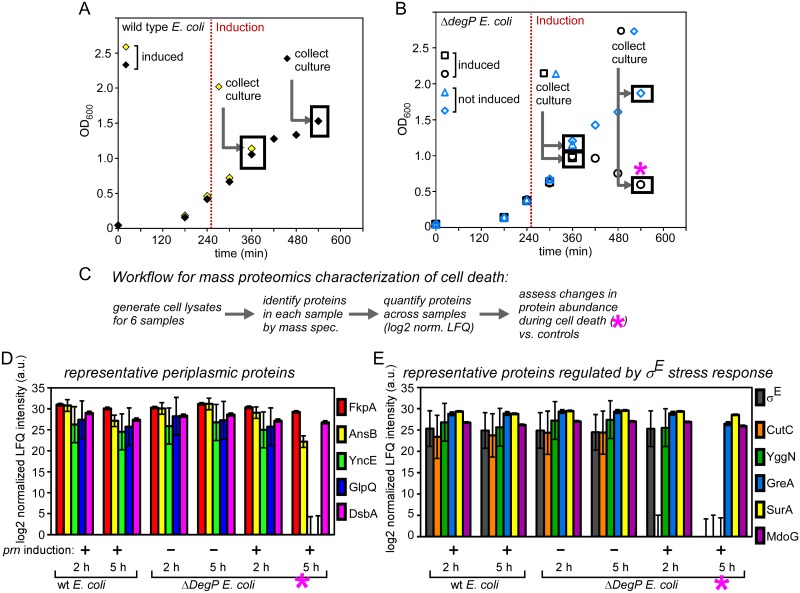
Fig 6. Analysis of proteome-wide changes during pertactin-induced death of E. coli ΔdegP.
(A, B) Expression of prn was induced in the presence (A) or absence (B) of a chromosomal copy of degP and cells were collected at 2 and 5 h post induction for mass spectrometry. For wild type E. coli, two samples were collected for mass spectrometry analysis (2 h and 5 h post prn induction). For the degP deletion strain, a total of four samples were collected (2 h and 5 h post prn induction and uninduced controls at the same time points). To express prn, construct T5p-prn was used and expression was induced in mid-log phase (see also Fig 2B). (C) Workflow to generate dataset for unbiased analysis of the proteome during E. coli death. (D) Quantification of representative periplasmic proteins across all experimental conditions indicates that overall periplasmic proteins decrease during death (last condition, see pink star in (B, C)). (E) Quantification of proteins in the σE stress response pathway reveals a loss of σE during death (last condition, pink star). Note that the σE protein itself along with CutC and YggN are undetectable in the last condition. Error bars correspond to the standard error (∑/mean) for each label-free measurement.

