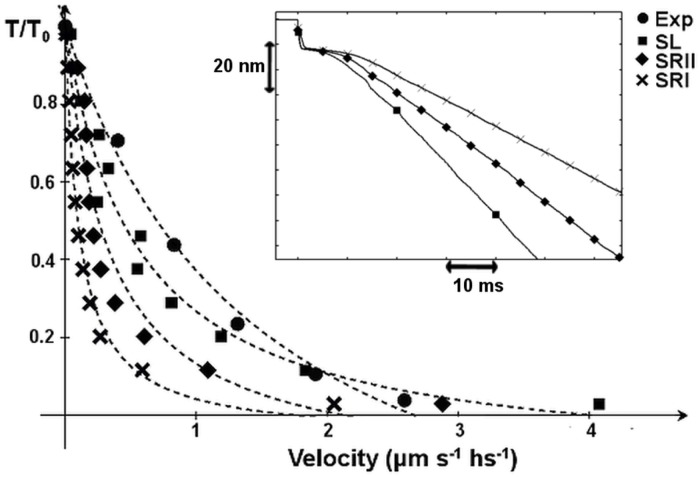
Fig 4. Isotonic contraction experiments give the force velocity curve (dashed lines represent the Hill’s curve fitting).
Experimental data are from [33]. The SL model produces a higher contraction velocity under the same tension with respect to SRII and SRI, where the latter is the slower case. The boxed inset shows an isotonic experiment at T = 0.2T0. All scenarios qualitatively reproduce the four experimentally observed phases [34].

