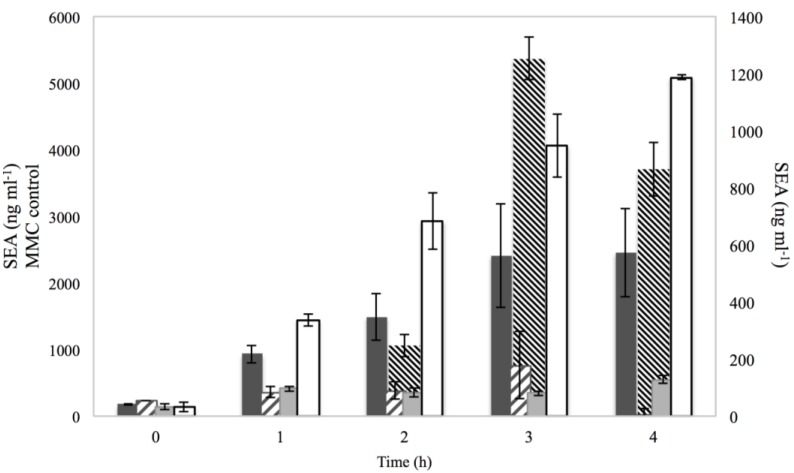
Figure 5.
SEA levels produced by Sa17 steady state cells under exposure in batch conditions to 2% NaCl ( ), 0.15% sorbic acid (
 ), 2% NaCl + 0.15% sorbic acid (
 ) and the controls of MMC (
 ) and BHI with no additives (□), obtained from two independent experiments. The left Y axis represents the SEA in ng·ml−1 for MMC control, while the right Y axis represents the SEA in ng·ml−1 for NaCl, sorbic acid, NaCl + sorbic acid and BHI with no additives. The X axis represents the time in h.

