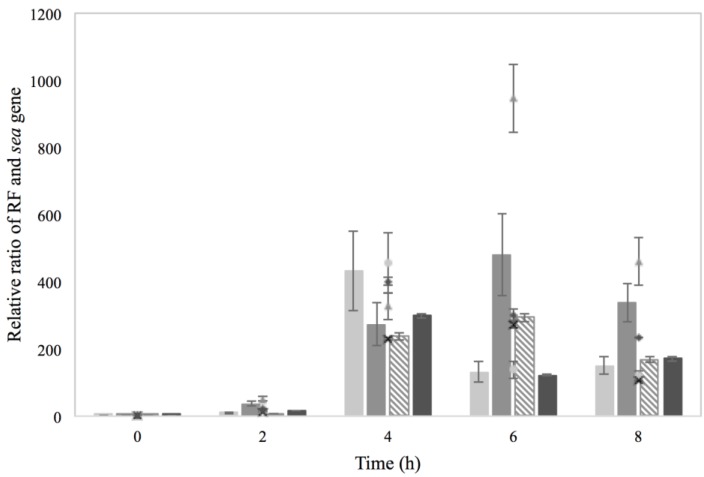
Figure 7.
RF (bars) and sea gene (symbols) copies formed in batch cultivation of Sa17 cells under exposure to either NaCl stress or optimal conditions. The cells were pre-grown under optimal or NaCl stress. The Y axis represents the relative ratio levels of RF and sea gene as calculated from Cq values obtained from one independent experiment and the X axis represents the time in h. The investigated treatments are designated: Co–Co with ( ) and (
 ), Co–Na with (
 ) and (
 ), Na–Co with (
 ) and (×) and Na–Na with (
 ) and (
 ).
).

