
Fig. 1.
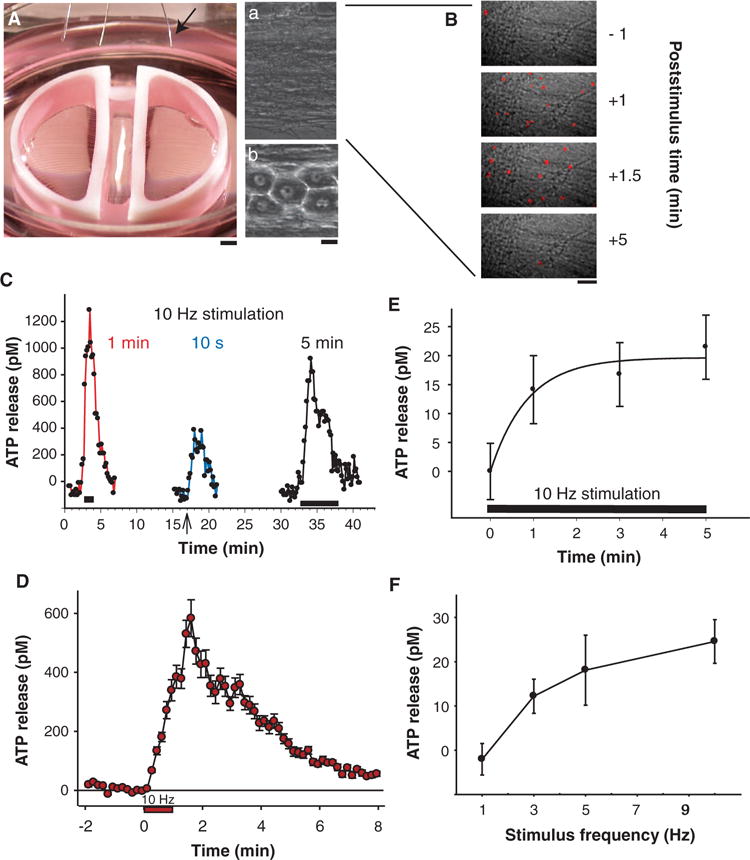
Release of ATP from axons firing action potentials. (A) Mouse DRG neuron cell bodies (b) and axons (a) were separated in multicompartment cell cultures allowing electrical stimulation of axons, growing under a high-resistance partition between compartments, through platinum electrodes in the lid of the culture dish (arrow). (B) Release of ATP from neurons was detected by single-photon imaging after addition of luciferin and luciferase to the medium and by analysis of ATP concentration in samples of culture medium assayed by luminometry. Release of ATP was detected as single photons (red spots) generated by the ATP-dependent chemiluminescence reaction. Each image in the time series displays the number of photons accumulated during 1 s, superimposed on a bright-field image of the axons. After calibration against standard solutions, photon counts provide a quantitative measure of ATP concentration. (C) ATP release could be induced repeatedly from the same axons. Onset and duration of the 10-Hz stimulus is shown by black bars (1 and 5 min) and arrow (10 s). (D) ATP concentration recovered to values that were not significantly different from prestimulus levels 7 min after termination of the 60-s, 10-Hz stimulus (red circles) (P > 0.05, n = 11). (E) Prolonged stimulation was not required for ATP release; near-maximal concentrations were reached within 1 min of 10-Hz stimulation (n = 48, measured by luminometry). (F) Low-frequency stimulation was effective in releasing ATP, and the release was proportional to stimulus frequency between 1 and 10 Hz (n = 61). [ATP concentration in bulk medium measured by luminometry [(E) and (F)] was ~40 times lower than that in close proximity to the cell measured by single-photon imaging microscopy [(B) to (D)].] Scale bars, 1 mm (A), 10 μm [(A, b) and (B)].