
Fig. 4.
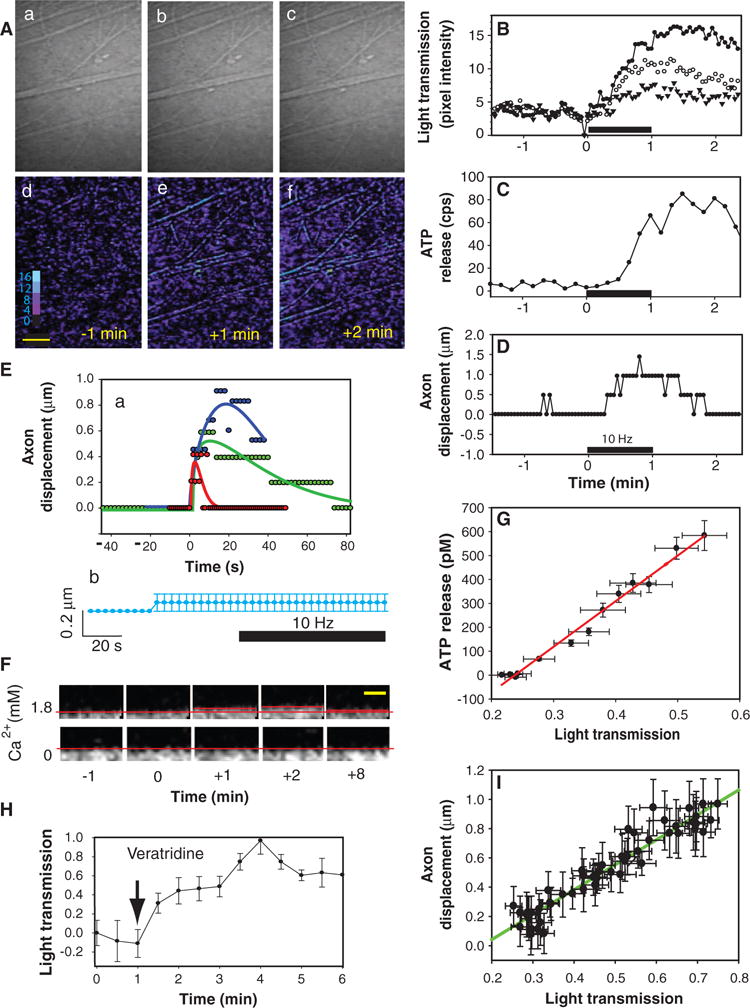
Neural impulses cause microscopic swelling and displacement of axons correlated with ATP release. (A) IOSs, representing changes in light transmission through axons, were measured with time-lapse transmitted light microscopy (a to c). [Warmer colors indicate greater light transmission (d to f).] The increase in IOS 1 and 2 min after 60-s stimulation at 10 Hz is shown in (Ae) and (Af). (B) Raw IOS data from three axons or fascicles shown in (A) are plotted. (C) ATP release, measured in the same axons by single-photon imaging microscopy, closely tracked the electrically induced changes in IOS. cps, counts per second. (D) Minute displacement of the axons was measured in the same axons after digital magnification of the transmitted light image and tracking movement of the edge of the axon membrane over time. The plotted data appear pixilated because the small axon displacements are near the 0.5-μm resolution of the microscope. (E) Axon displacement could be detected after as few as 10 action potentials at 10 Hz (red). Stimulating the same axons for 5 s (green) and 10 s (blue) produced proportionately larger and longer-lasting displacements (curve fitting by regression to a five-parameter Weibull function). No axon displacement was seen during electrical stimulation in the presence of 1 μM TTX to block sodium-dependent action potentials (b) (n = 7, mean and SEM are plotted in light blue). (F) Axon displacement in response to 10-Hz stimulation (60 s) was also measured by confocal microscopy. Note the 1.5-μm displacement of axon 2 min after 10-Hz stimulation for 60 s. Stimulation in the absence of extracellular calcium inhibited axon displacement. (G) Linear regression of data from multiple experiments showed that ATP release (rise to peak) was highly correlated with the increase in light transmission through axons (P < 0.0001; r2 = 0.983; n = 12). (H) The increase in light transmission, indicative of axon swelling, could be induced by the sodium channel agonist veratridine (2 μM) (n = 8) in the absence of electrical stimulation. One minute after veratridine application, ATP concentration increased by 156.7 ± 35.7 pM (P < 0.007, paired t test; n = 6). (I) Axon displacement also was directly related to the increase in light transmission (P < 0.0001; r2 = 0.9078; n = 48). Scale bars, 17 μm (A), 5 μm (F). Transmitted light intensity is shown on an eight-bit pseudo color scale (Ad).