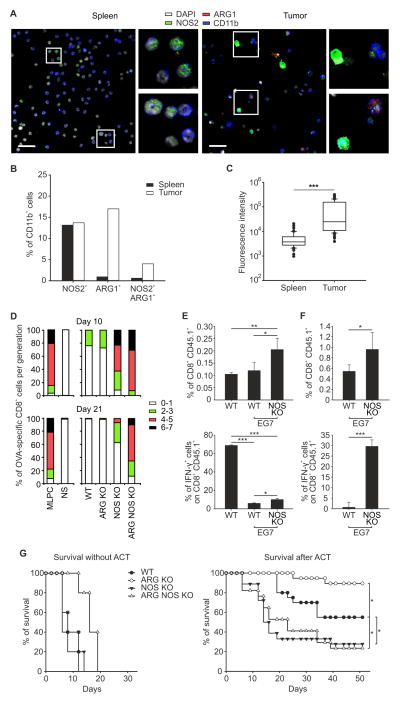
Figure 1. NOS2 is essential for effective ACT.
(A) Representative images of CD11b+ cells sorted from spleens or tumors of EG7 tumor-bearing WT mice stained for NOS2, ARG1 and DAPI. Scale bar, 25 μm.
(B, C) CD11b+ cells sorted from spleens or tumors of EG7 tumor-bearing WT mice were quantified for the percentage of ARG1+, NOS2+, and ARG1+NOS2+ cells (B) or for fluorescence intensity of NOS2 expression (C, Median [50th percentile] represented as a line inside the box. Lines at the bottom and top of the box represent, respectively, the 25th and the 75th quartile, the whiskers represent 10th and 90th percentile. Outliers beyond the whiskers are individually plotted as black dots; *** p ≤ 0.001, unpaired Student t-test analysis). n=357 cells from spleen or from tumor were evaluated.
(D) CD11b+ cells from tumors of WT, ARG KO, NOS KO or ARG NOS KO mice were sorted and co-cultured with OVA-specific, CFSE-labeled, CD8+CD45.1+ T lymphocytes in the presence of OVA peptide. Percent of proliferating T cells within a given number of cell divisions (from 0 to 7 as indicated) is shown in bar graph format relative to positive control (mixed lymphocyte peptide culture [MLPC], lymphocytes stimulated with OVA peptide) or negative controls without OVA (NS, not stimulated).
(E, F) WT and EG7 tumor-bearing WT and NOS KO mice were adoptively transferred with OVA-specific CD8+CD45.1+ T lymphocytes. Cells derived from spleens (E) or tumors (F) were stimulated with OVA peptide and percent of CD45.1+CD8+ cells and IFN-γ+ cells shown in CD45.1+CD8+ gate. Mean ± s.d.; n=4, representative of 3 independent experiments. ***p ≤ 0.001, **p ≤ 0.01 and *p ≤ 0.05, by using One Way ANOVA.
(G) Survival percentages of EG7 tumor bearing WT and KO mice either untreated (n=5, for each group) or treated with ACT (WT n=20; ARG KO n= 15; NOS KO n=18; ARG NOS KO n=17). *p ≤ 0.05, logrank test.
See also figure S1.

