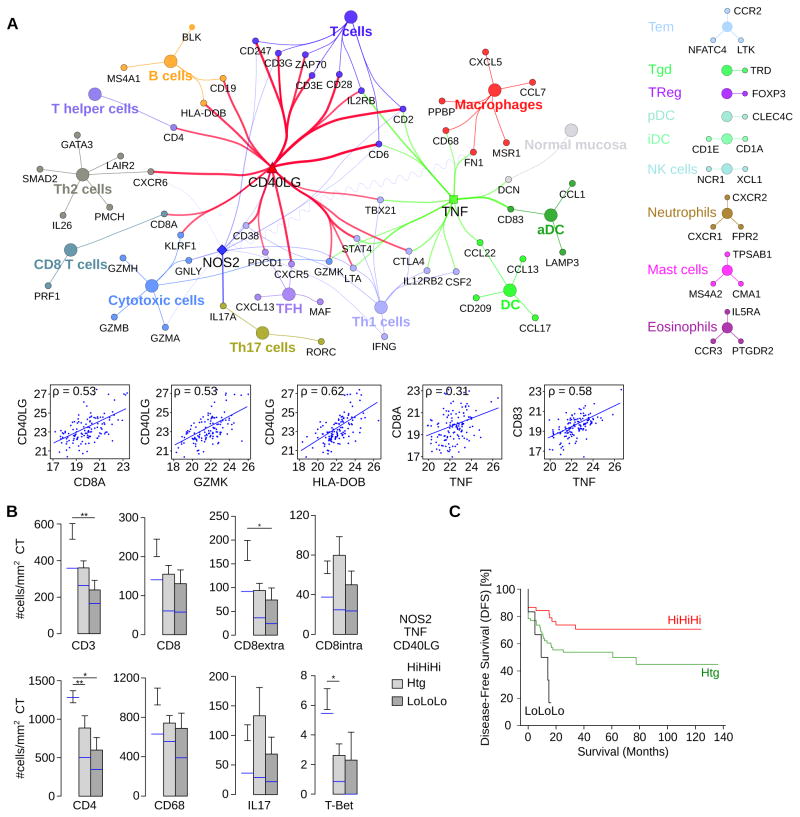
Figure 7. CD40LG, NOS2 and TNF correlate with survival in human CRC.
(A) Correlations between CD40LG, NOS2 and TNF expression (qPCR) in CRC (n=125 patients) and immunome markers visualized in a ClueGO-CluePedia network. Markers associated to specific immune cell populations share the color of the node. The lines between nodes (edges) represent Spearman’s rank correlation values and are colored in red (CD40LG, ρ >0.5), blue (NOS2, ρ >0.2) and green (TNF, ρ >0.5), respectively. Negative correlation is shown with a sinusoidal line. The lower graphs show pair-wise correlation plots corresponding to the network edges.
(B) Density of immune cells (number of positive cells per mm2 of tissue surface area) infiltrating the center of the tumor (CT) in patients with (HiHiHi), heterogeneous (Htg) or low (LoLoLo) expression of CD40LG, NOS2 and TNF. A parametric or nonparametric test was applied. Error bars, mean ± s.e.m.; n=107. The median cell count/mm2 is shown in blue, ** p ≤0.01, and * p ≤0.05.
(C) Disease free survival (DFS) for patients having high, heterogeneous, and low expression of CD40LG, NOS2 and TNF is shown.
See also figure S7.

