
Fig. 2. Color and achromatic percepts are represented by different cell populations.
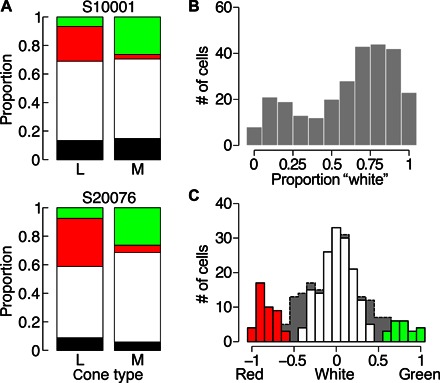
(A) Distribution of color-naming behavior from S10001 (n = 77 and 51 for L- and M-cones, respectively) and S20076 (n = 97 and 48 for L- and M-cones, respectively). Colors correspond to the percepts reported; black indicates not seen. (B) Distribution of white responses elicited from all L- and M-cones (n = 273). (C) Distribution of RG metric across all L- and M-cones (n = 273). The red, white, and green bars represent the cones that have response purities greater than the Monte Carlo distribution mean. The gray dotted area denotes the low-purity cones (n = 48).