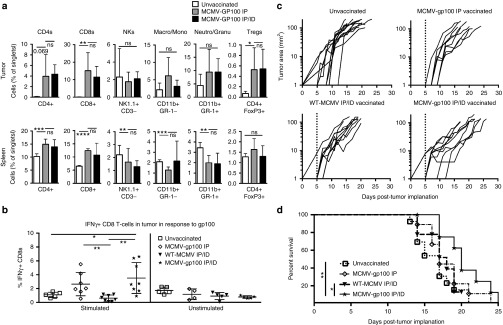
Figure 2.
Intraperitoneal (IP) and intradermal (ID) infection with MCMV-gp100 induced poor antitumor responses. Animals received 1 × 10⁵ B16F0s subcutaneously on day 0 followed by IP or IP/ID vaccination with MCMV-gp100 or WT-MCMV on day 5, post implantation. The data shown is combined from three separate experiments. (a) Lymphocytes in the tumor (top panel) and spleen (bottom panel) after MCMV-gp100 vaccination. Data are represented as the mean ± SD. Significance was assessed by unpaired t-tests, ns, P > 0.05; *P < 0.05; **P < 0.01;, ***P < 0.001; ****P < 0.0001; NKs, NK cells; Neutro, Neutrophil; Granu, Granulocyte; Macro, Macrophage; Mono, Monocyte; Treg, regulatory T cell. (b) IFN-γ production of CD8+ T-cells recovered from tumors at sacrifice and stimulated or not ex vivo with the native gp100 peptide (n = 5–9 mice). Represented as the mean ± SD. (c) Tumor growth curves showing the growth, by area, of individual tumors from unvaccinated (n = 13) MCMV-gp100 IP vaccinated (n = 9), WT-MCMV IP/ID vaccinated (n = 9), and MCMV-gp100 IP/ID vaccinated mice (n = 10). The dotted line indicates the day of vaccination. (d) Kaplan–Meier survival curve of treated animals. Significance was assessed by the logrank test, *P < 0.05; **P < 0.01; ***P < 0.001; ****P < 0.0001. CMV, cytomegalovirus; MCMV, vaccination with murine-CMV.

