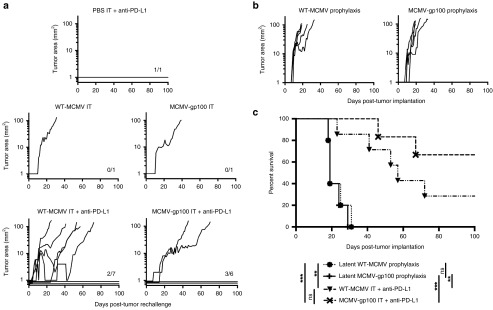
Figure 7.
Primary tumor clearance after MCMV IT treatment induces resistance or rejection of secondary tumor challenges. Any animal that cleared a primary tumor was rechallenged with 2 × 10⁵ B16F0s in their opposite flank 2–3 weeks after initial tumor clearance. (a) Shown is the tumor growth starting from the day of tumor rechallenge. For the sake of clarity and fitting the data to a log scale, individual tumor area lines are spaced out below 1 mm2 when no nodule was evident. Fractions in each graph represent the number of animals that rejected tumor challenge out of the number of animals tested. (b) Mice were infected by the IP route with 2 × 10⁵ plaque forming units WT-MCMV or MCMV-gp100 and 2 × 10⁵ B16F0s were implanted subcutaneously 106 days later. Shown is the tumor growth as displayed in Figure 2. T-cell responses in the blood of these mice, prior to tumor implantation, are shown in Figure 1c,d. (c) Kaplan-Meier survival curve of rechallenged mice from WT-MCMV IT + anti-PD-L1 treated, MCMV-gp100 IT + anti-PD-L1 treated and prophylactically WT-MCMV or MCMV-gp100 vaccinated mice. Significance was assessed by a logrank test, P > 0.05 is nonsignificant; *P < 0.05; **P < 0.01; ***P < 0.001; ****P < 0.0001.

