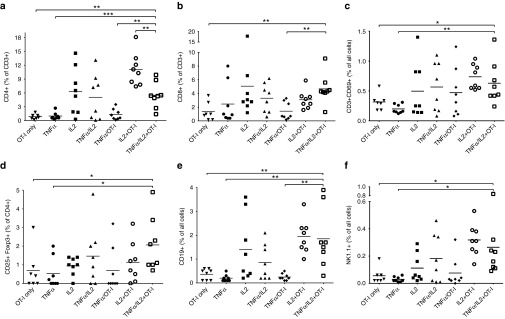
Figure 4.
Tumor-infiltrating lymphocyte subsets following treatment with adenovirus and OT-I combination. Percentages of (a) CD4+ T-cells, (b) CD8+ T-cells, (c) CD3+CD69+ activated T-cells, (d) CD3+CD25+Foxp3+ regulatory T-cells, (e) CD19+ B-cells and (f) NK1.1+ Natural killer cells in B16.OVA tumors treated with 1.5 × 10⁶ CD8-enriched OT-I T-cells and adenoviruses. Horizontal lines, mean values. *P < 0.05, **P < 0.01, ***P < 0.001.

