Figure 6.
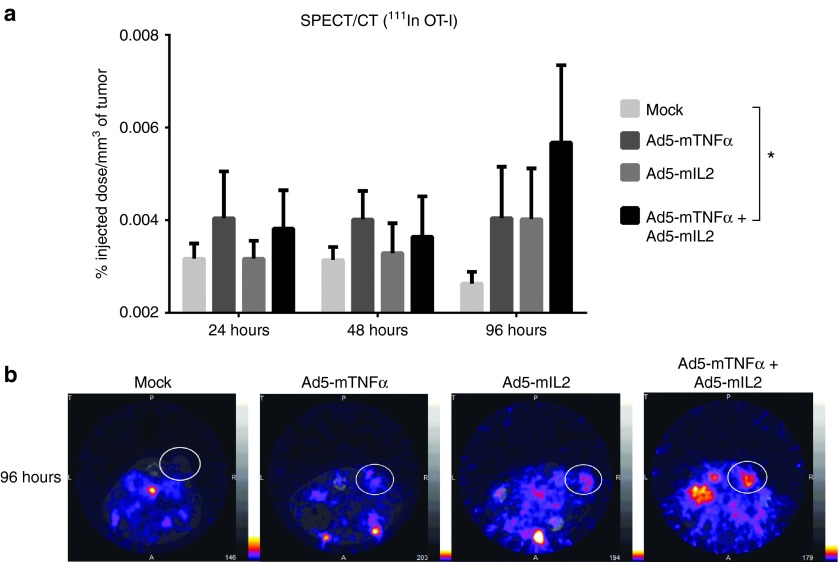
SPECT/CT imaging of radiolabeled OT-I T-cells adoptively transferred to adenovirus-treated mice. B16.OVA tumor-bearing mice were administered 6 × 10⁶ 111Indium-oxine labeled OT-I T-cells intraperitoneally with simultaneous intratumoral injection of cytokine-coding adenoviruses. Mice were imaged on 24, 48, and 96 hours after treatment with a four-headed gamma camera with integrated CT system (nanoSPECT/CT). The results were calculated as percentage of the injected dose per tumor volume (%ID/mm3) (a). Representative SPECT/CT images of 96 hours timepoint with white circles indicating the locations of subcutaneous tumors (b). Error bars, mean + SEM. *P < 0.05, repeated measures analysis of variance.

