Figure 7.
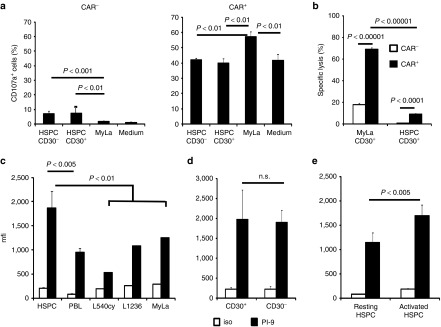
Hematopoietic stem and progenitor cells (HSPCs) did not induce CD30-specific degranulation of chimeric antigen receptor (CAR) T cells, are protected against bystander lysis and express high levels of the granzyme B inhibitor PI-9. (a) CAR T cells specifically degranulate in the presence of CD30+ lymphoma cells but not CD30+ HSPC cells. Anti-CD30 CAR T cells (4 × 10⁴ cells/well) were coincubated with CD30+ MyLa lymphoma cells and flow-sorted CD30+ or CD30– HSPCs (each 2 × 10⁴ cells/well), respectively. Degranulating T cells were identified by staining for CD107a. After 12 hours, T cells were recovered, stained additionally with anti-CD3 and anti-human IgG1 antibodies to detect CD3+ CAR+ and CD3+ CAR– T cells, respectively, and analyzed by flow cytometry. Mean values ± SD of triplicates were determined and p values calculated by the Student's T-test. (b) HSPC bystander lysis by CAR T cells in the presence of CD30+ MyLa lymphoma cells. Carboxyfluorescein diacetate succinimidyl ester-(CFSE) labeled MyLa cells (2 × 10⁴ cells/well) and CD30+ HSPCs (1 × 10⁴ cells/well) were together cocultivated with T cells with or without CAR. Cells were harvested, labeled with an anti-CD34 antibody and 7-AAD and the number of viable and dead CD34+ HSPCs was determined; specific target-cell lysis was calculated as described in Materials and Methods. Data represent mean ± SD of triplicate samples. Statistic analysis was performed by using the Student's T-test. Data of a representative analysis out of two are shown. (c,d) HSPCs express high levels of the granzyme B inactivating PI-9 protease. HSPCs from umbilical cord blood of healthy donors (n = 6) were activated for 3 days, stained for PI-9 or with an isotype control antibody (iso) and CD30, respectively. For comparison, peripheral blood lymphocytes of healthy donors (n = 4) and cells from lymphoma cell lines (n = 3) were stained and analyzed by flow cytometry. (c) Comparison of PI-9 expression between HSPC, peripheral blood lymphocytes and lymphoma cell lines, respectively. (d) Comparison of PI-9 expression between CD30+ and CD30– HSPC. Data represent mean values ± SD where applicable. (e) HSPCs upregulate PI-9 upon cytokine-mediated activation. Isolated HSPCs (n = 3) were cultivated either without activation or activated for 3 days as described above. Cells were recovered and stained for PI9 and analyzed by flow cytometry. Data represent mean values ± SD. Statistical analysis was performed by using the Student's T-test and significant differences were indicated.

