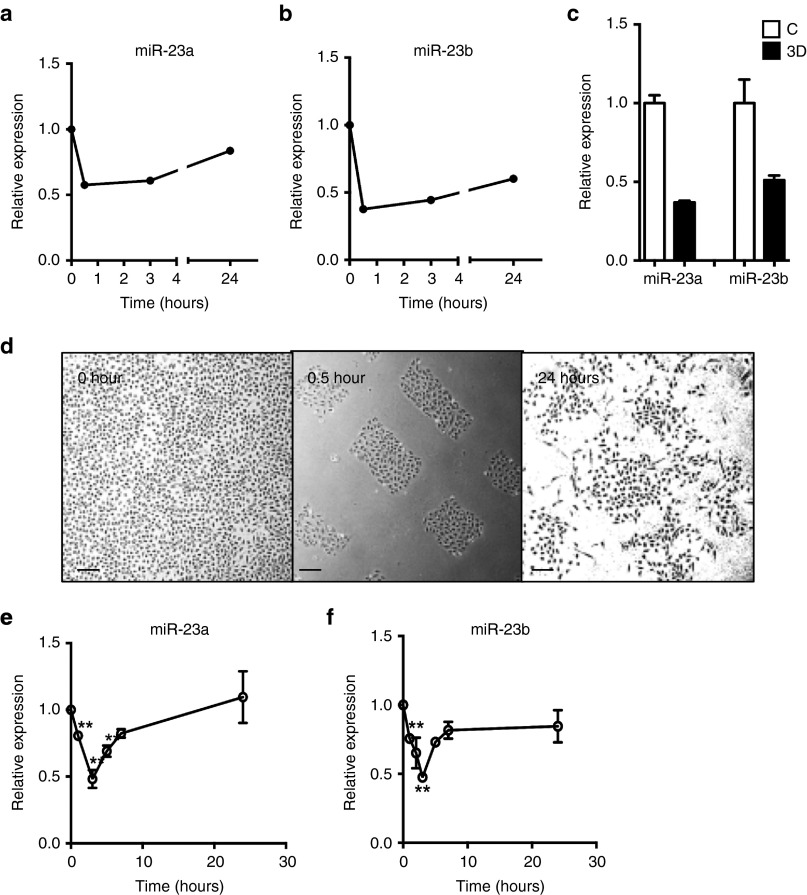
Figure 2.
Expression pattern of miR-23a and miR-23b during angiogenesis. (a) Expression of miR-23a and (b) miR-23b in EC during in vitro 3D collagen angiogenesis assay measured by microarray. (c) Confirmation of microarray by real-time PCR. C = nonangiogenic, 3D = in vitro 3D collagen angiogenesis assay. mean ± SEM; n = 2. (d) Morphology of EC either before wounding (0 hour) and 0.5 and 24 hours after wounding. Representative of three experiments. Scale bar = 100 μm. Quantification of miR-23a (e) and miR-23b(f) after scratch (mean ± SEM; n = 3). Data is compared with the levels in the confluent cells. Expression levels were measured by qRT-PCR with results of microRNA normalized to U48. *P < 0.05; ***P < 0.001; ****P < 0.0001 by unpaired two-tailed t-test. qRT-PCR, quantitative reverse transcriptase polymerase chain reaction.

