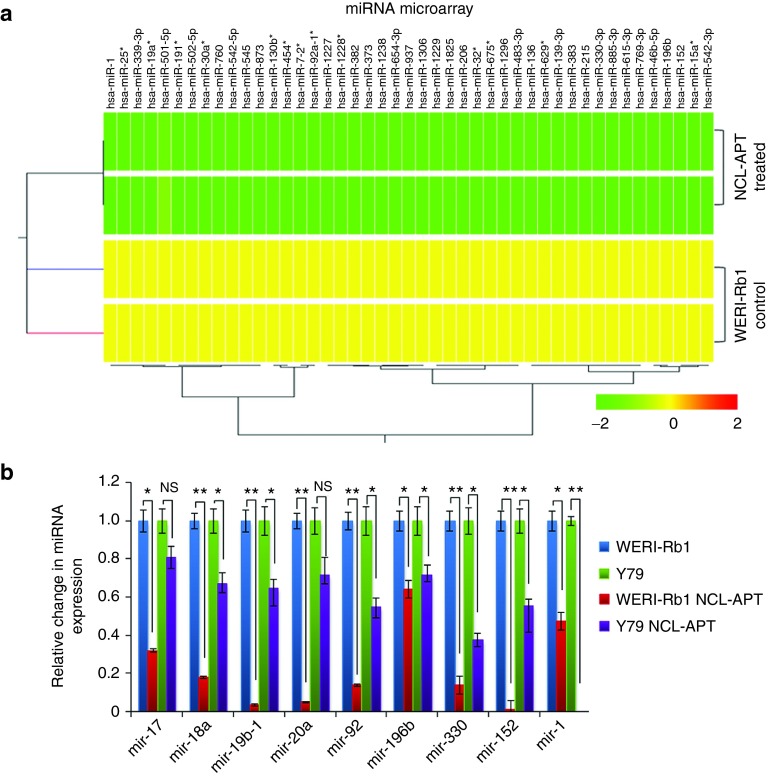
Figure 2.
Effect of NCL-APT on miRNA expression. (a) Hierarchical clustering of the miRNAs from the WERI-Rb1 cell line and cells treated with NCL-APT. The colour range indicates the status of expression (yellow being midrange and green being downregulation). (b) Fold changes in the miRNA levels - mir-196b, mir-330, mir-152, mir-1, mir-17, mir-18a, mir-19-1, and mir-20a in Y79 and WERI-Rb1 cell lines treated with NCL-APT normalized with untreated cells.

