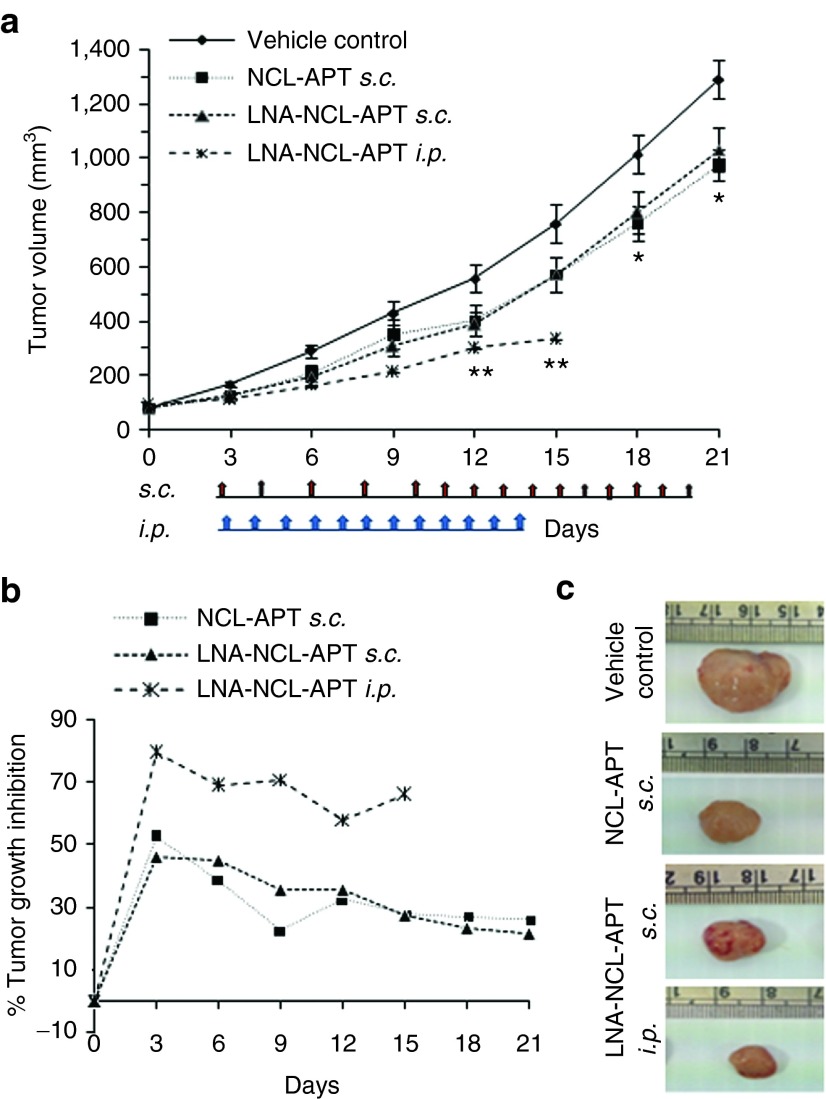
Figure 4.
Antitumor effect of NCL-APT and LNA-NCL-APT on Y79 xenograft model. (a) Graph showing the change in percentage tumor growth inhibition of the groups injected with NCL-APT and LNA-NCL-APT subcutaneously near the tumor site and LNA-NCL-APT by intraperitoneal route. Photographs showing the representative animals (b) and excised tumors (c) showing the changes in tumor growth upon treatment by s.c. and i.p. routes. The error bar in panel A represents the SEM and the * indicates significance of P < 0.05 and ** indicates significance of P < 0.001.

