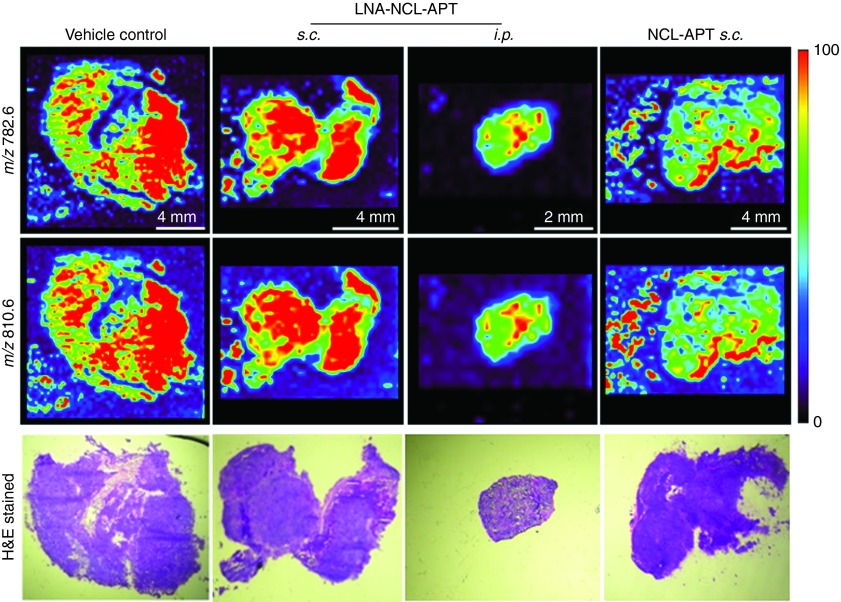
Figure 7.
Changes in PC levels upon in vivo assessment of NCL-APT and LNA-NCL-APT. (a) DESI MS images of cryosection from the vehicle control and treatment groups. Images represent the distribution of phosphatidylcholines across the tissue sections. (b) H&E stained images of the tissue sections. Images were presented without alteration, acquired at 10X magnification.

