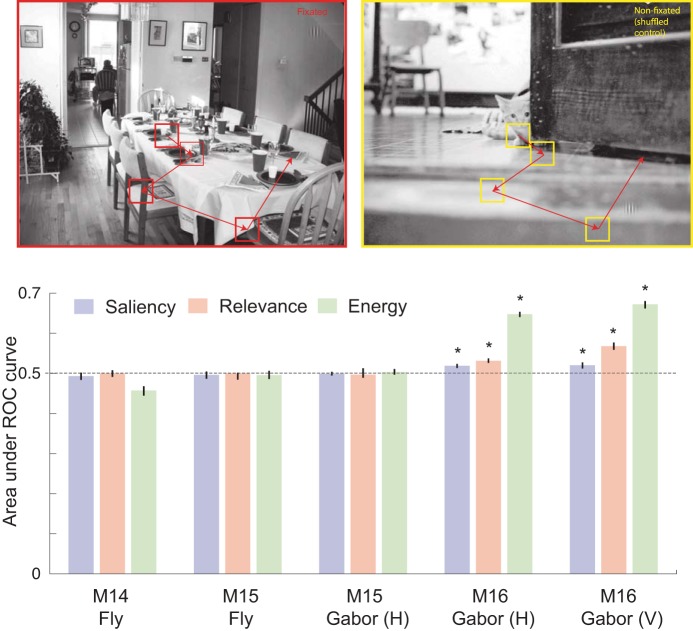
Fig. 5.
Prediction of gaze using visual features at fixation. We compared bottom-up IK-saliency, top-down relevance, and energy at fixated (top left) and nonfixated, i.e., shuffled control (top right) targets by computing the area under the receiver operator characteristic (ROC) curves (bottom). *Statistically significant difference from a chance level of 0.5 at a significance level of P < 0.05.

