
Fig. 7.
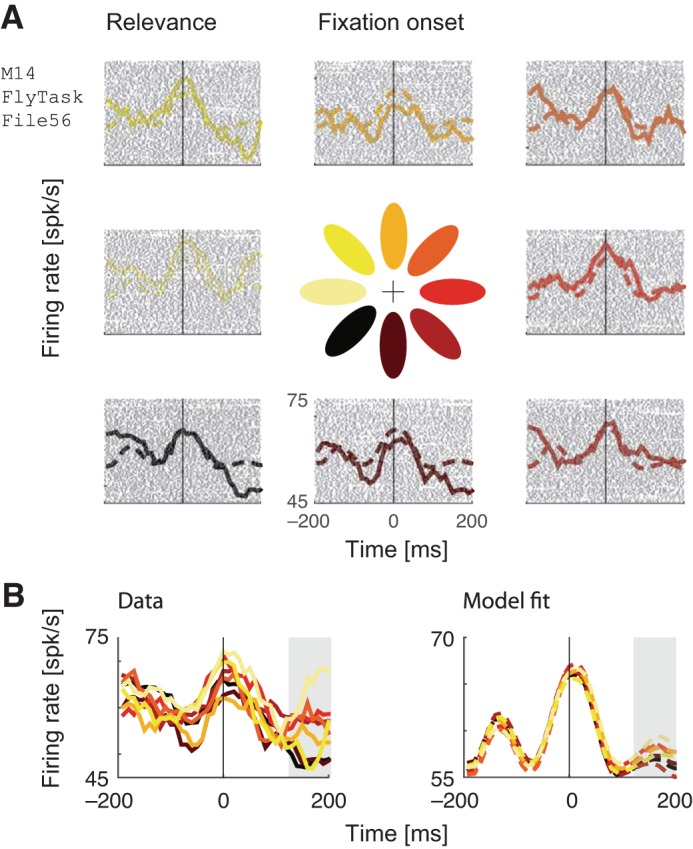
Example neuron fit using a relevance-only model. The model was fit to an independent held-out half of the data that is not visualized here. A: raster plots, fixation-aligned PSTHs, and model predictions, separated into 8 categories according to the direction of the maximally relevant octant (color-coded in the central glyph). B: data and model PSTHs aligned to the fixation onset do not show a clear tuning to direction of maximum relevance during the fixation onset, but do show a modest tuning at ∼200 ms after fixation, as indicated by the gray panel.