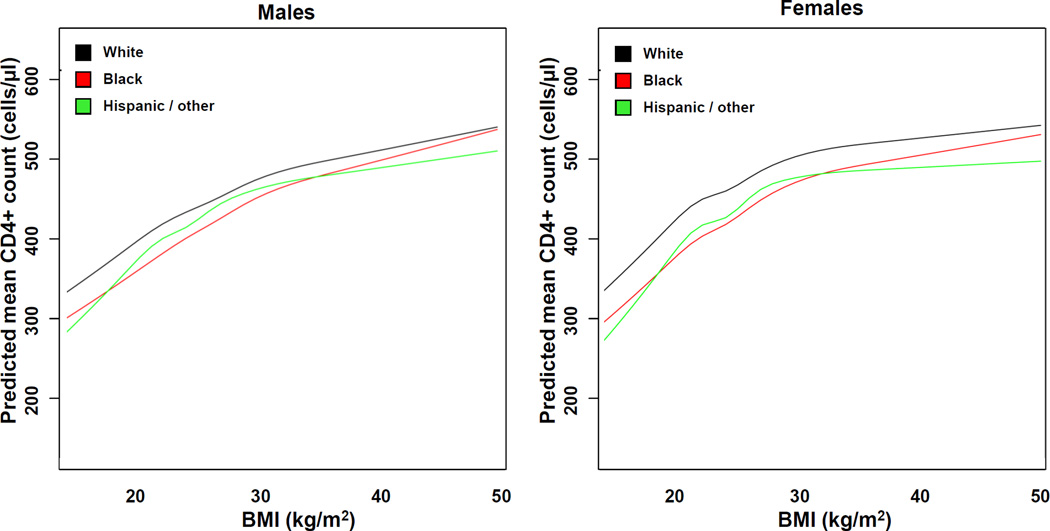
Figure 2. Body mass index and predicted mean CD4 count on ART, stratified by race and sex.
Predicted mean CD4 count values for the designated race are plotted using a linear mixed effects model.
Model is adjusted for time since ART initiation, age, initial ART regimen class, year of ART start, baseline CD4+ count and log10-transformed HIV 1-RNA, and cohort. Two-way interactions between BMI and time, sex, and race were also included in the model. To create the figure, all variables not included in the figure were set at their median or most common levels (except regimen class was set to PI-based).
Abbreviations: ART, antiretroviral therapy; BMI, body mass index.

