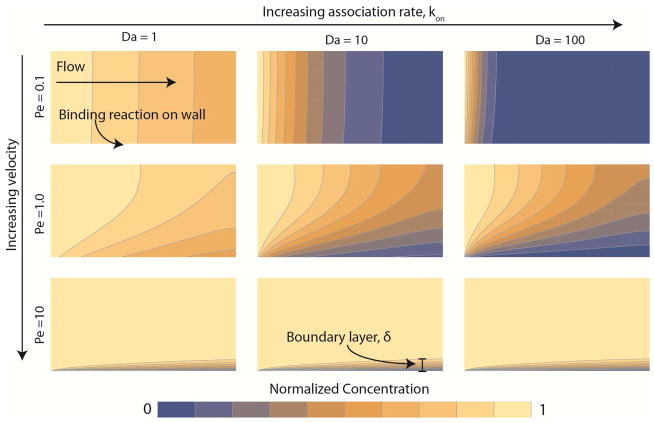
Figure 1. The influence of flow and reaction kinetics on the distribution of substrate for a binding reaction.
Flow moves from left to right. The substrate enters the domain on the left at a normalized concentration of unity (yellow) and is consumed by a binding reaction on the bottom wall leading to near-wall concentration of zero (blue). The binding reaction follows Langmuir kinetics (Eq. 1) . The velocity increases going down each column by one order-of-magnitude, and consequently increases the Peclet number (Pe, Eq. 6) by the same amount. Note the formation of a thin boundary layer of thickness δ near the bottom wall at Pe = 10, where convective flux is ten-fold higher than diffusive flux. The binding rate, kon, increases across each row by one order-of-magnitude, resulting in a higher Dahmkohler number (Da, Eq. 11). For Da greater than unity (middle and right columns), the substrate is completely consumed at the wall leading to a transport-limited regime.

