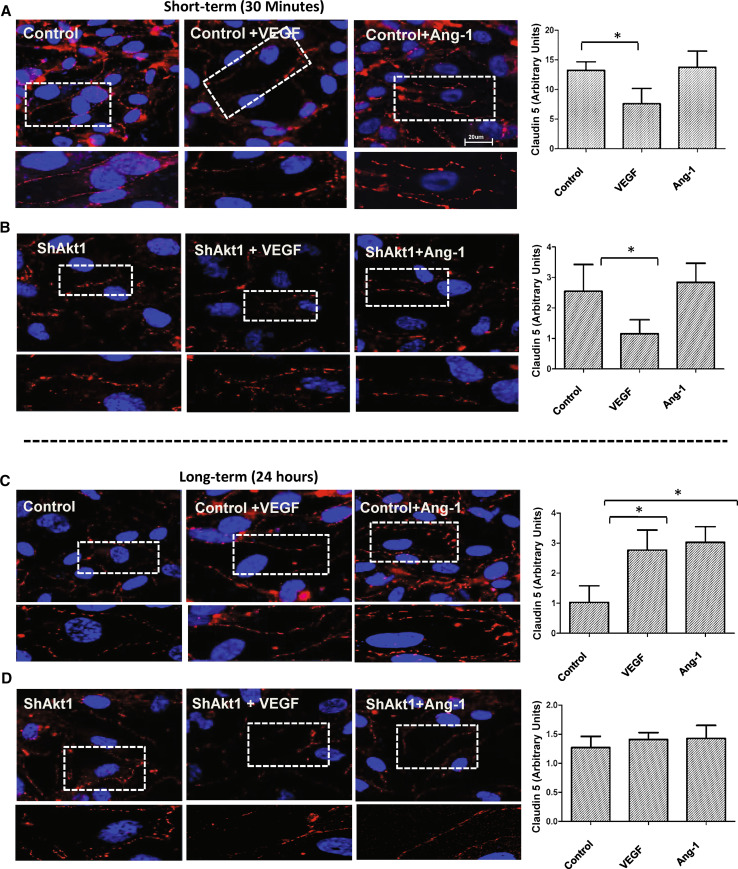
Fig. 6.
Long-term, not short-term changes in claudin-5 expression in HMEC is regulated by Akt1. a, b Representative images of claudin-5 staining of ShControl and ShAkt1 HMEC monolayers after 30 min (short-term) treatment with 20 ng/ml VEGF or 50 ng/ml Ang-1, compared to PBS control, respectively. Quantification of the claudin-5 expression levels in HMEC monolayers following VEGF and Ang-1 treatment as analyzed using NIH-Image J software is provided in the right panels (n = 10). c, d Representative images of claudin-5 staining of ShControl and ShAkt1 HMEC monolayers after 24 h (long-term) treatment with 20 ng/ml VEGF or 50 ng/ml Ang-1, compared to PBS control, respectively. Quantification of the claudin-5 expression levels in HMEC monolayers following VEGF and Ang-1 treatment as analyzed using NIH-Image J software is provided in the right panels (n = 10). *P < 0.01 (scale bar 20 µM)

