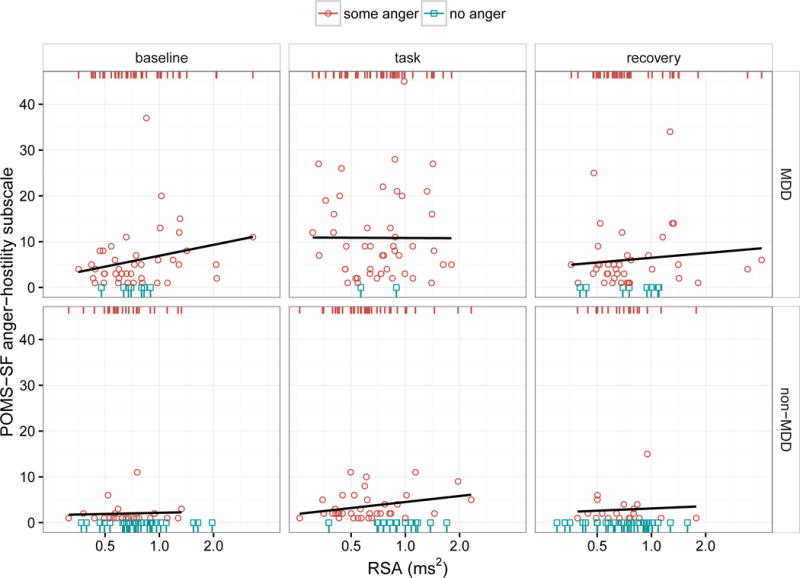
Figure 2.

Scatter plots of POMS anger scores (y axis) as a function of concurrent RSA measurements (x axis with log scale) across groups (rows) and experimental condition (columns). The effect of MDD and RSA on anger was modeled in two stages. In the first stage, we predicted the presence vs. absence of anger as indicated by red circles and blue squares, respectively. The red and blue rugs at the top and bottom of each panel simply reiterate and separate the x-values (RSA magnitude) by the presence vs. absence of anger, respectively. These rugs, as opposed to the scatter plots, should be used for interpreting the effect of RSA in the context of the logistic models reported in Table 2; in other words, the y-dimension (anger magnitude) is completely irrelevant to these models and is considered separately in the second stage of modeling by fitting a least-squares regression to the non-zero anger data only. The regression lines in these plots reflect this second stage and are only fit to the red circles (where there is actual variance in anger magnitude), not the blue squares. In summary, this approach treats anger as a two-process phenomenon: 1) a “switch” that “flips” between discrete states of not angry vs. angry (e.g., think of the red rug as “on” and the blue rug as “off”) and 2) a “knob” that “dials” the magnitude of anger up or down. These are two independent questions, and it is possible for RSA or MDD to predict the “anger switch” but not the “anger knob”, or vice versa. In this case, there is only evidence that RSA is related to concurrent anger as a discrete state: within the non-MDD group and the task condition, note the relative separation of the blue and red rugs, indicating that higher task RSA was associated with the complete absence of anger. However, none of the regression lines fit to the non-zero anger values were significant, indicating that, within the subsample showing non-zero anger, the magnitude of RSA was not associated with the magnitude of anger. (As discussed in the switch vs. dial metaphor, these two findings are independent of one another and should not be viewed as contradictory.) MDD, on the other hand, was related to both presence and magnitude of anger as reflected by the greater number of blue squares (zero anger) in the non-MDD panels and larger y-values for the red circles in the MDD panels.
