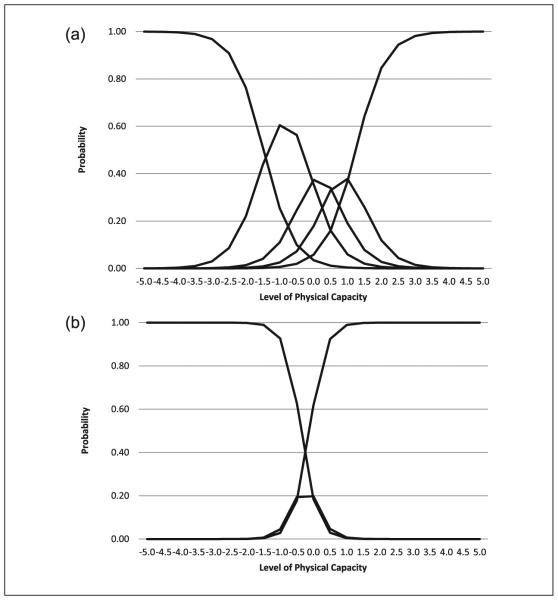
Figure 1.
Comparison of walking performance test and self-report item (IRT item characteristic curves): (a) Performance Test Walking Speed Score (0,1,2,3,4); (b) Self-report Walking Item (0,1,2).
Note. The x-axis represents levels of physical capacity where 0 is the group mean. Negative values represent levels of physical capacity below the group mean in SDs and positive values represent levels of physical capacity above the group mean in SDs. The y-axis represents the probability of endorsing a response: for performance items, scores of 0, 1, 2, 3, 4 shown as 5 lines starting from the left; for self-report items, scores of 0, 1, 2 shown as 3 lines starting from the left. Examples of interpretation: for persons in the physical capacity range at −2.0 (lower functioning at 2 SD below the mean), the probability of a score of 0 on the walking speed test is about 70% and the probability of a score of 1 is about 20%; on the walking self-report item, the probability of a score of 0 is virtually 100%. For persons in the physical capacity range at 2.0 (higher functioning at 2 SD above the mean), the probability of a score of 4 is a little over 80%, a score of 3 is about 15%, and there is a less than 5% chance of a score of 2; on the walking self-report item virtually all persons have a score of 2. IRT = item response theory.

