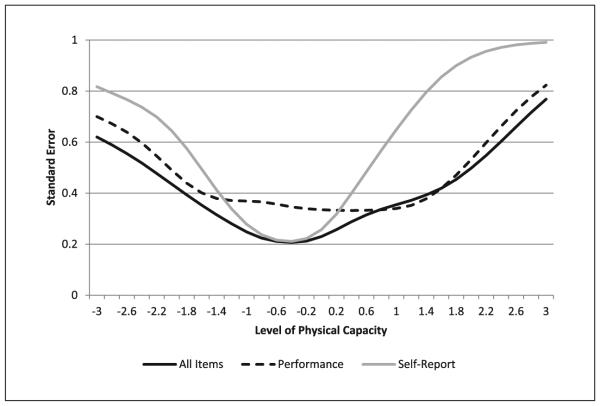
Figure 2.
Standard error of the score estimate for physical capacity using all items, performance-based items only, and self-report items only.
Note. The x-axis represents levels of physical capacity where 0 is the group mean. Negative values represent levels of physical capacity below the group mean in SDs and positive values represent levels of physical capacity above the group mean in SDs. Standard Errors are shown on the y-axis where larger values represent larger standard errors. Standard errors are lower across the physical capacity spectrum for the measure using all items, particularly at the higher end relative to self-report only and from 1 SD below and above the mean relative to performance only.

