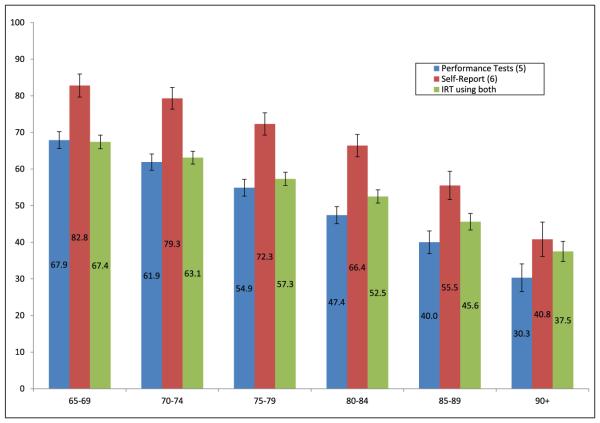
Figure 3.
Mean physical capacity based on performance tests, self-report items and IRT score by age group.
Source. National Health and Aging Trends Study (NHATS; 2011).
Note. N = 7,609 persons 65 years and older. Excludes nursing home residents. IRT = item response theory.

