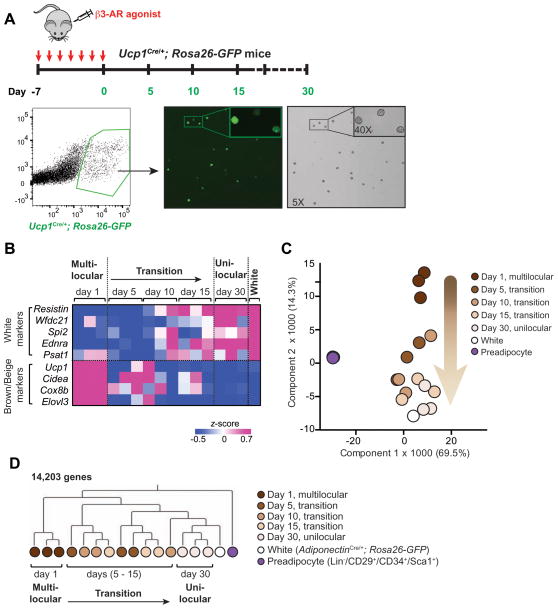
Figure 2. Beige adipocytes directly acquire molecular characteristics of white adipocytes after withdrawing external stimuli.
(A) Top panel: Schematic illustration for isolating GFP-positive adipocytes by FACS at the indicated time points in the inguinal WAT of Ucp1Cre/+;Rosa26-GFP reporter mice. Bottom panel: Gating strategy for isolating GFP-positive adipocytes. GFP positive adipocytes were visualized after sorting at day 1 of β3-AR agonist withdrawal. Note that all the FACS-isolated cells (bright-field) express GFP and that all of the GFP positive cells from day 1 of β3-AR agonist withdrawal contained multilocular lipids.
(B) Expression profiles of the WAT-enriched genes and brown/beige fat-enriched genes in the GFP-positive FACS-isolated beige adipocytes at indicated time points after β3-AR agonist withdrawal as described in (A). The color scale shows z-scored FPKM representing the mRNA level of each gene in blue (low expression)-white-red (high expression) scheme. Gene expression in the white adipocytes FACS-isolated from the inguinal fat pad of age-matched AdiponectinCre/+;Rosa26-GFP reporter mice is shown in the right column.
(C) Principal component analysis (PCA) of transcriptome in FACS-isolated beige adipocytes (Ucp1Cre/+;Rosa26-GFP), FACS-isolated white adipocytes (AdiponectinCre/+;Rosa26-GFP), and undifferentiated adipocyte precursors (Lin−/CD34+/CD29+/Sca1+) from the SV fraction of inguinal WAT of age-matched wild-type mice. The number in parentheses represents the proportion of data variance explained by each PC.
(D) Hierarchical clustering of beige adipocytes, white adipocytes, and undifferentiated adipocyte precursors. The clustering was generated based on the RNA-sequencing data of GFP-positive beige adipocytes at day 1 of β3-AR agonist withdrawal (multi-locular state), at days 5, 10, and 15 of withdrawal (transition phase), and at day 30 of withdrawal (unilocular state). White adipocytes and undifferentiated precursors are shown in white and purple circles, respectively. The clustering was visualized by MeV. The horizontal distance represents similarities among each cluster.

