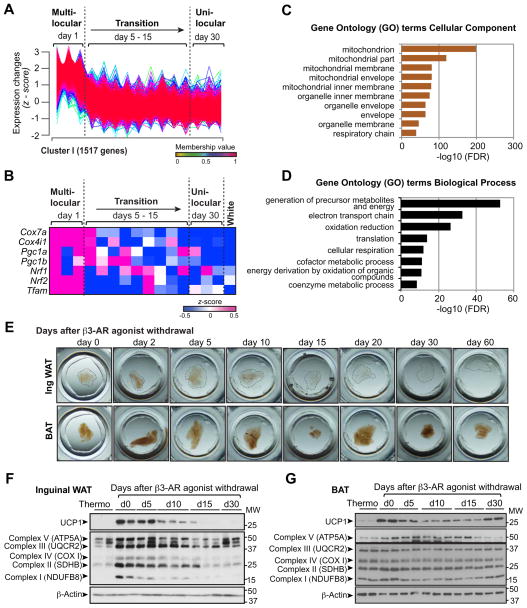
Figure 3. Beige-to-white adipocyte transition is accompanied by mitochondrial clearance.
(A) Gene expression profile of 1,517 genes that belongs to Cluster I during the beige-to-white adipocyte transition. Y-axis represents expression changes in the expression level (z-scored FPKM) of each gene. Gene expression profiles of other clusters are shown in Figure S3A.
(B) Expression profiles of brown/beige-enriched mitochondrial genes (Cox7a and Cox4i1) and key transcriptional regulators of mitochondrial biogenesis (Pgc1a, Pgc1b, Nrf1/2, and Tfam) in the GFP-positive adipocytes at indicated time points after β3-AR agonist withdrawal. The color scale shows z-scored FPKM representing the mRNA level of each gene in blue (low expression)-white-red (high expression) scheme. Gene expression in the white adipocytes isolated from AdiponectinCre/+;Rosa26-GFP reporter mice is shown in the right column. n = 3 for each time point of beige-to-white transition.
(C) GO analysis (cellular component) of the genes in Cluster I (GO FAT).
(D) GO analysis (biological process) of the genes in Cluster I (GO FAT).
(E) Inguinal WAT and BAT depots (3–5mm diameter) at indicated time points after β3-AR agonist withdrawal were fixed in 4% PFA and cleared for optical imaging.
(F) Immunoblotting for UCP1 and the indicate mitochondrial complex components in the inguinal WAT depots of wild-type mice under thermoneutrality and at indicated time points (days 0 – 30) following β3-AR agonist withdrawal. β-actin was used as a loading control. Molecular weight (MW) is shown on the right.
(G) Immunoblotting for UCP1 and the indicate mitochondrial complex components in the interscapular BAT depots of wild-type mice in (F).

